Fig. 5.
Download original image
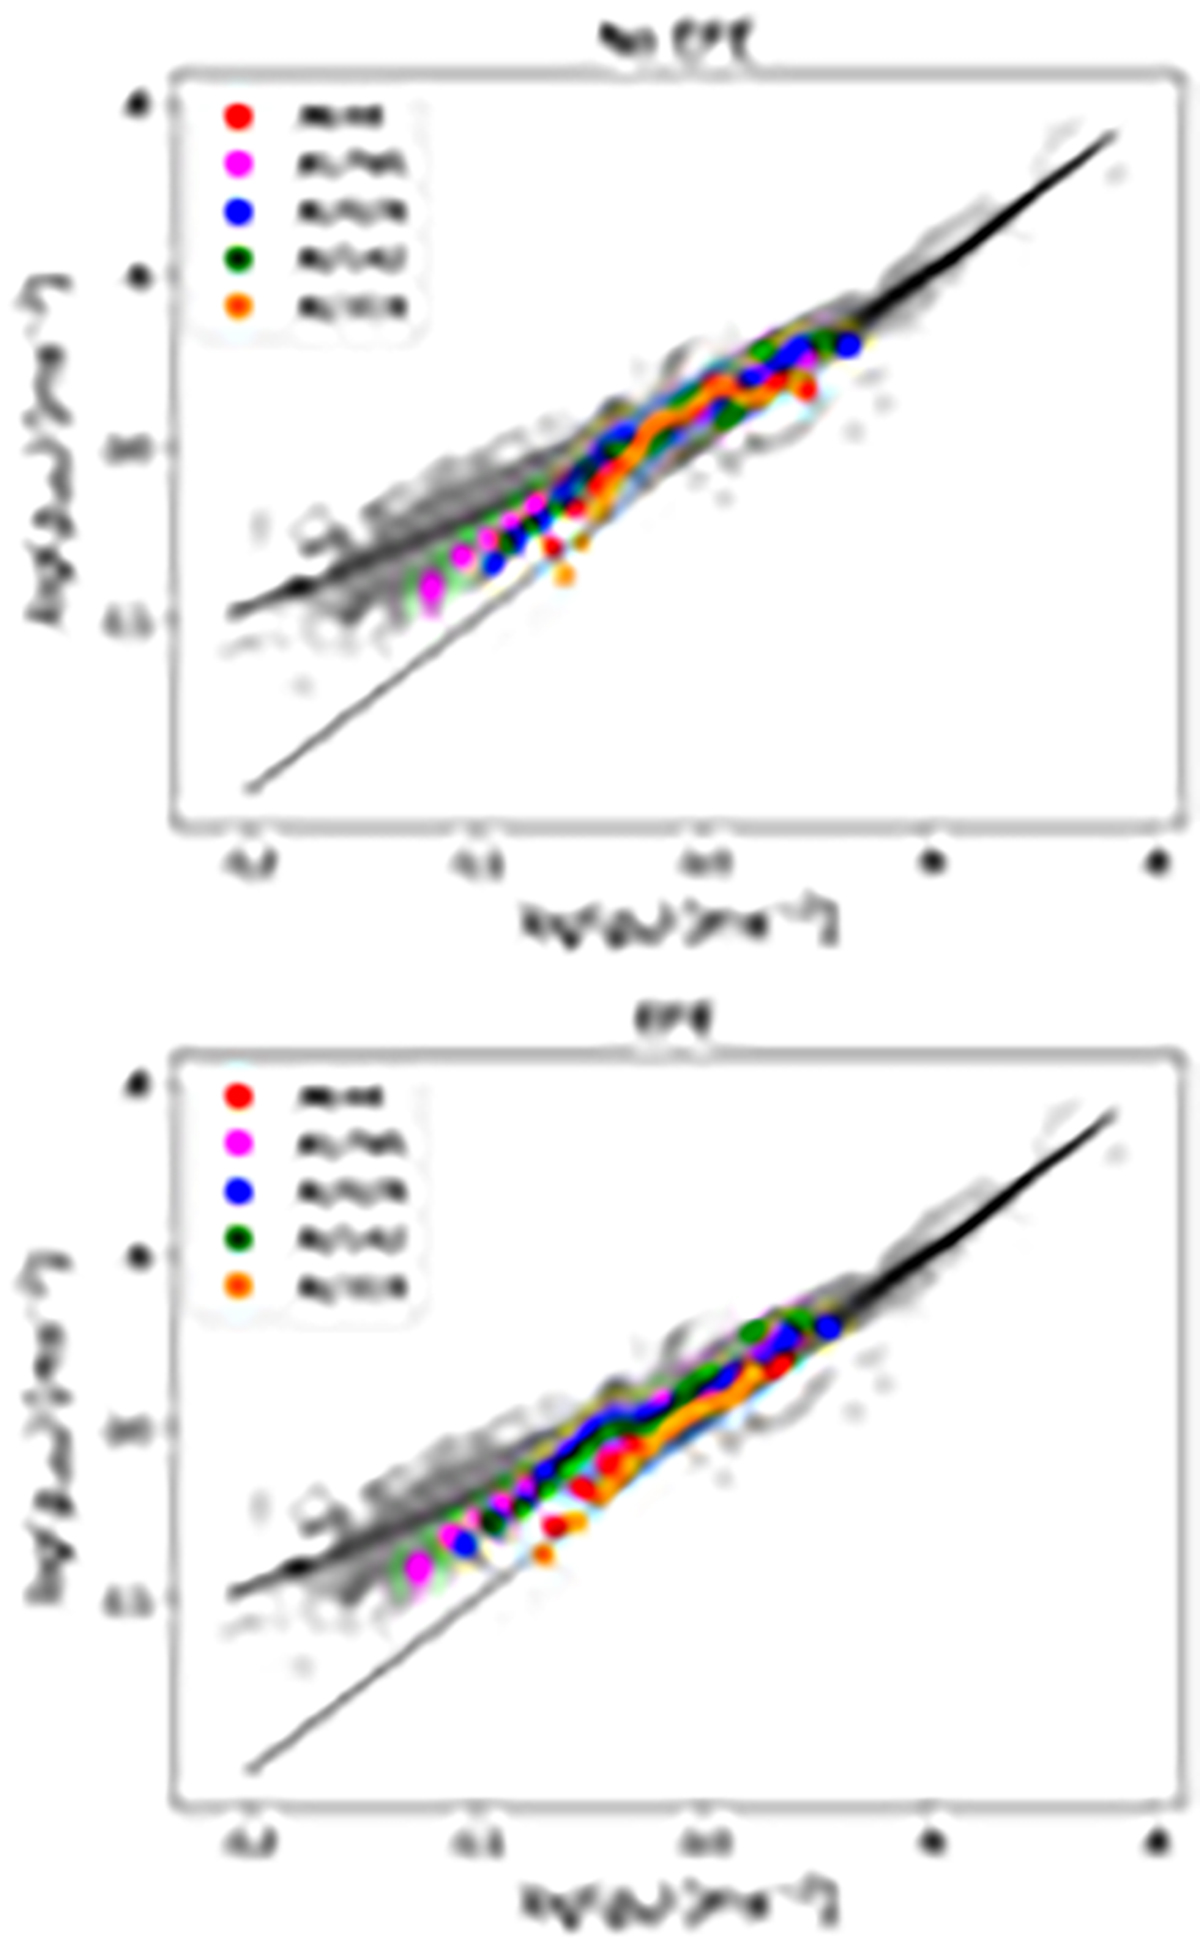
Locations of galaxy clusters on the radial acceleration relation after accounting for a missing mass component. The top panel corresponds to the isolated case (Eq. (9)), while the bottom panel to the EFE case (Eq. (10)). Grey points show disc galaxies from the SPARC database (Lelli et al. 2016), while coloured points show the five galaxy clusters in our sample. The solid line is the MOND prediction for isolated systems; the dashed line is the line of unity (Newtonian prediction with no DM). In the top panel, open symbols indicate data at R > 1 Mpc, where the mass models with no EFE have been extrapolated.
Current usage metrics show cumulative count of Article Views (full-text article views including HTML views, PDF and ePub downloads, according to the available data) and Abstracts Views on Vision4Press platform.
Data correspond to usage on the plateform after 2015. The current usage metrics is available 48-96 hours after online publication and is updated daily on week days.
Initial download of the metrics may take a while.