Fig. 4.
Download original image
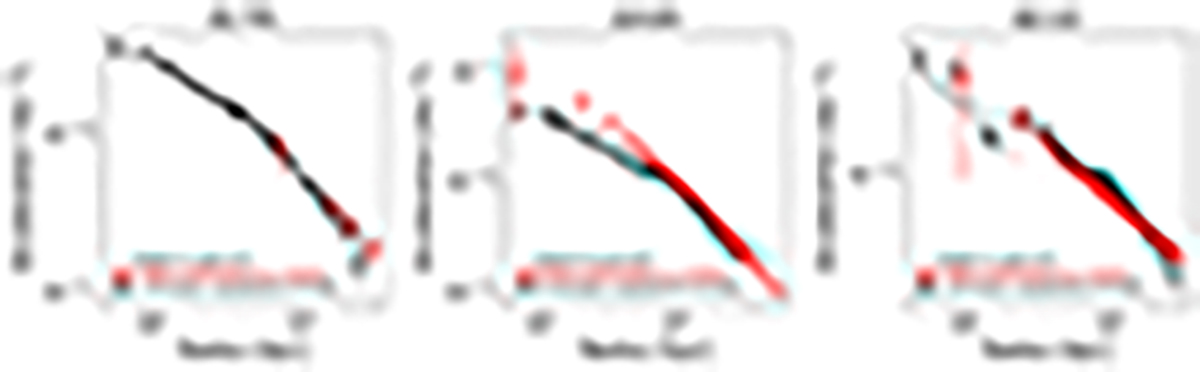
Comparison between acceleration profiles from hydrostatic equilibrium (black dots; from X-COP) and Jeans modelling of galaxy kinematics (red dots; from Li et al. 2023). The black line is the MOND EFE model fitted to the X-COP data (same as in Fig. 2). Remarkably, for A1795 and A2142, the MOND model at large radii predicts the behaviour of the stellar kinematic data. For A2029 the comparison between the two datasets is poor, probably due to incompleteness in the galaxy kinematic data and/or unusual galaxy velocity anisotropy (see Li et al. 2023).
Current usage metrics show cumulative count of Article Views (full-text article views including HTML views, PDF and ePub downloads, according to the available data) and Abstracts Views on Vision4Press platform.
Data correspond to usage on the plateform after 2015. The current usage metrics is available 48-96 hours after online publication and is updated daily on week days.
Initial download of the metrics may take a while.