Fig. 1.
Download original image
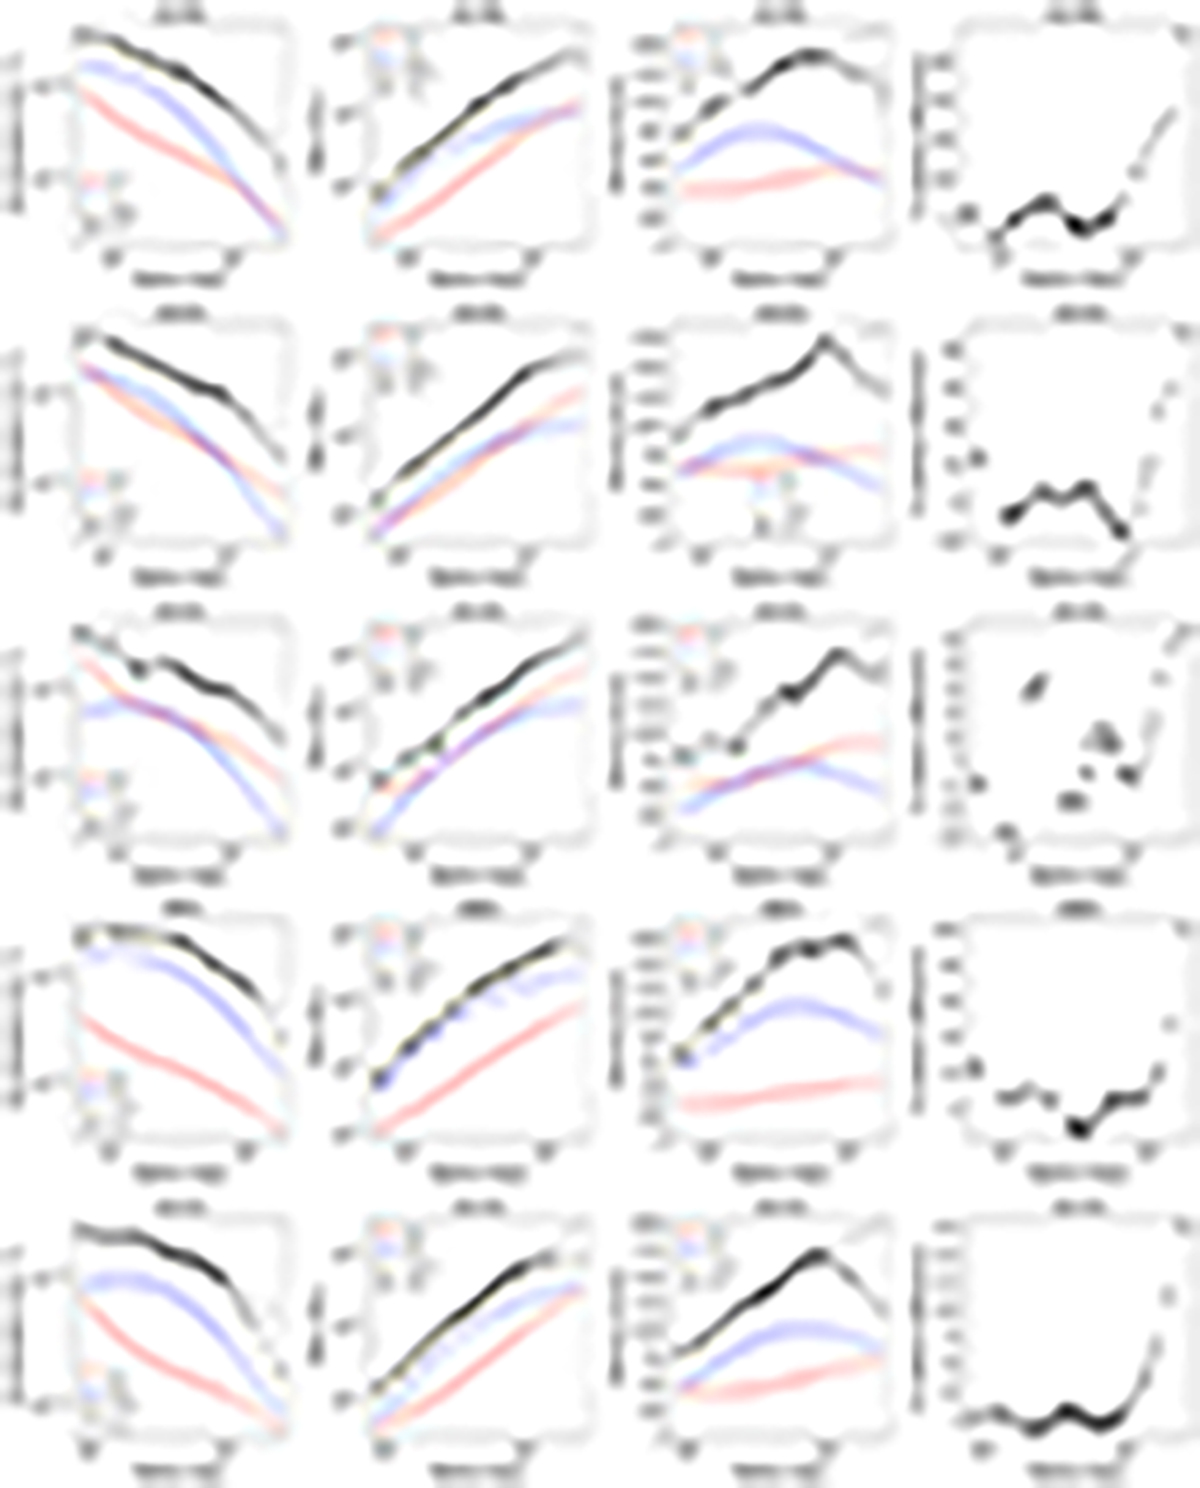
MCMC fit results for the isolated case (Eq. (9)). From left to right: acceleration profiles, enclosed mass profiles, circular-velocity profiles, and relative residual difference. In the first three panels, observed data (black points) are fitted with a mass model (black line) that includes the contribution of visible baryons (red line) and missing mass (blue line). We fit the data up to 1 Mpc (black points), where the hydrostatic bias should play a minor role, and then extrapolate the model to larger radii (grey line) to estimate the maximum hydrostatic bias in MOND (rightmost panels).
Current usage metrics show cumulative count of Article Views (full-text article views including HTML views, PDF and ePub downloads, according to the available data) and Abstracts Views on Vision4Press platform.
Data correspond to usage on the plateform after 2015. The current usage metrics is available 48-96 hours after online publication and is updated daily on week days.
Initial download of the metrics may take a while.