Open Access
Fig. 3.
Download original image
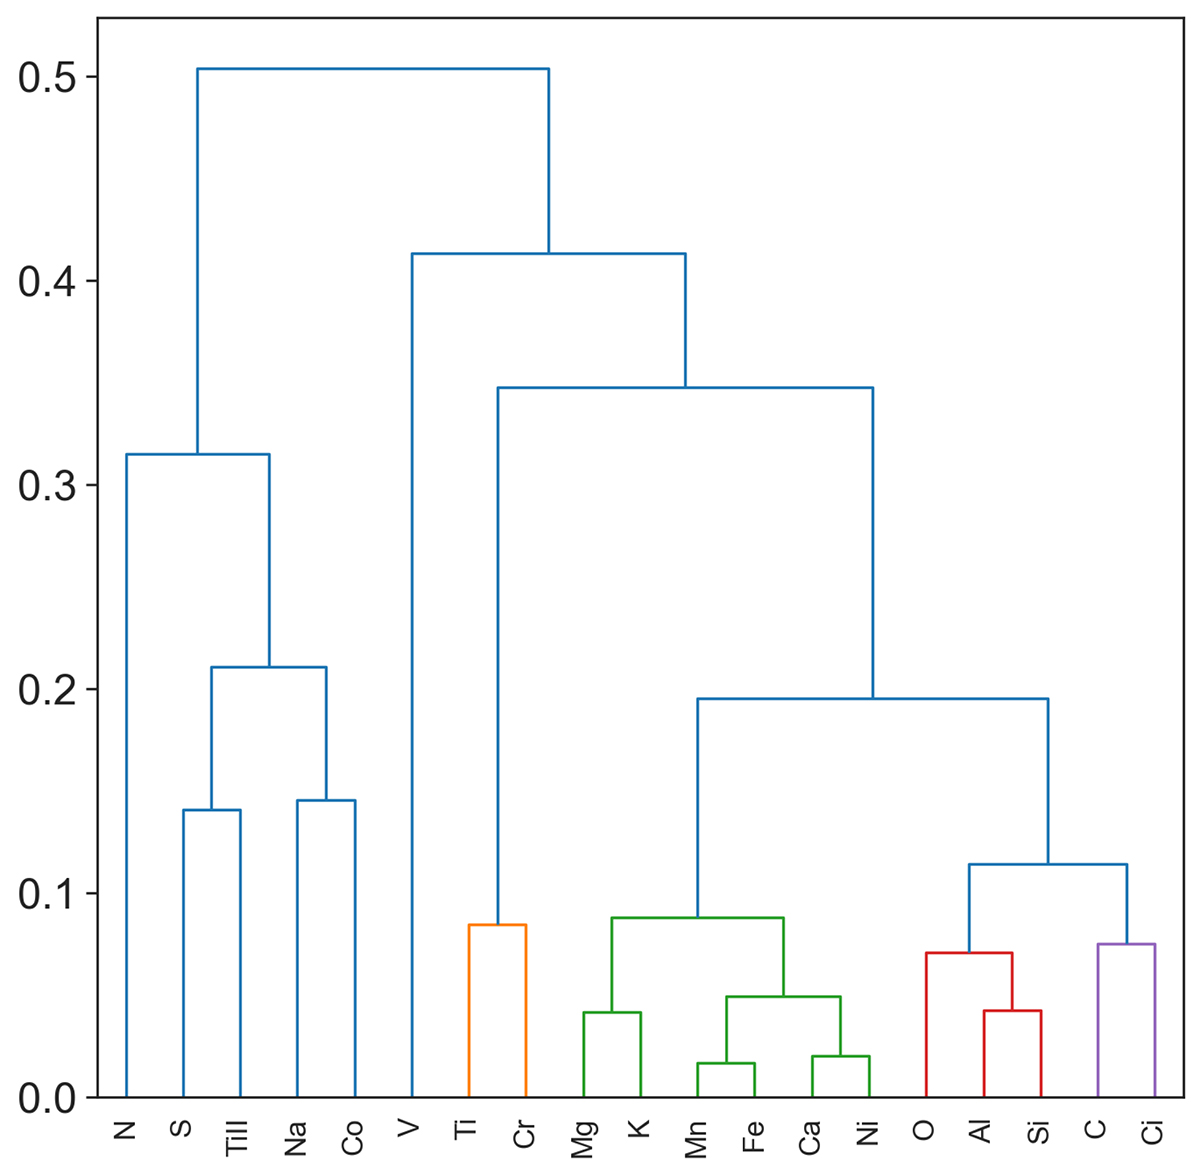
Hierarchical clustering on the Spearman rank-order correlations. The value of the y-axis is 1− the Spearman correlation coefficient. For example, the correlation coefficient between Ti and Cr is ≈0.93. Features with a correlation > 0.9 are grouped together, as indicated by the branch colors.
Current usage metrics show cumulative count of Article Views (full-text article views including HTML views, PDF and ePub downloads, according to the available data) and Abstracts Views on Vision4Press platform.
Data correspond to usage on the plateform after 2015. The current usage metrics is available 48-96 hours after online publication and is updated daily on week days.
Initial download of the metrics may take a while.