Fig. 2.

Download original image
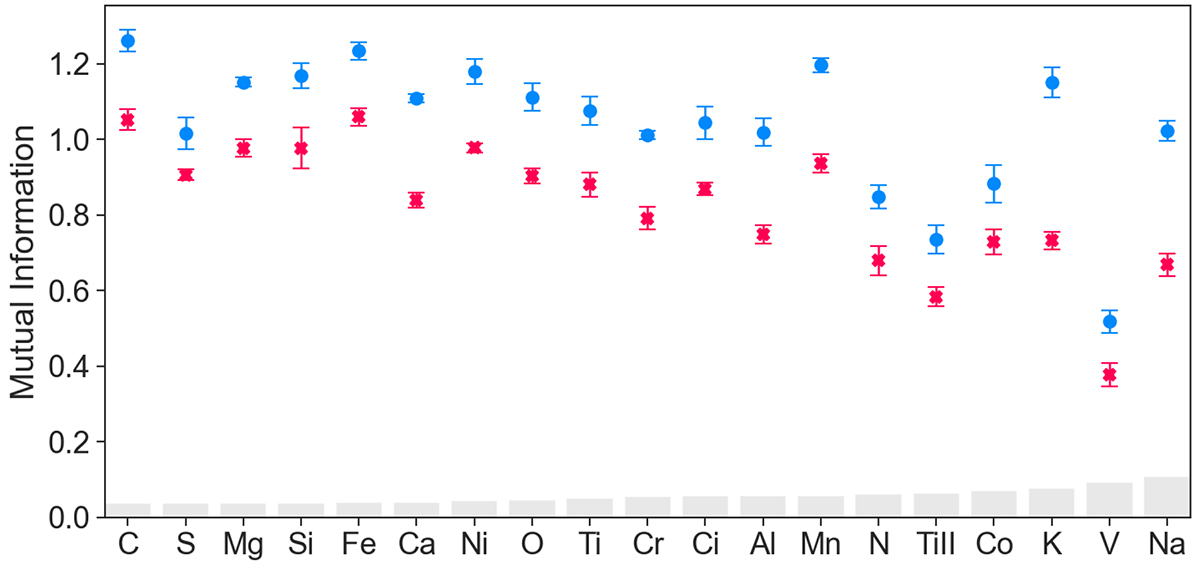
Mutual information (Eq. (2)) between every chemical abundance (x-axis) and the target variable y. The results shown are averaged across different random subsets of the dataset, and the error bars indicate the standard deviation. In blue we indicate the mean chemical abundances and in red the abundances perturbed with their provided uncertainty. The gray vertical bands indicate the median error of every feature.
Current usage metrics show cumulative count of Article Views (full-text article views including HTML views, PDF and ePub downloads, according to the available data) and Abstracts Views on Vision4Press platform.
Data correspond to usage on the plateform after 2015. The current usage metrics is available 48-96 hours after online publication and is updated daily on week days.
Initial download of the metrics may take a while.


