Fig. 1.
Download original image
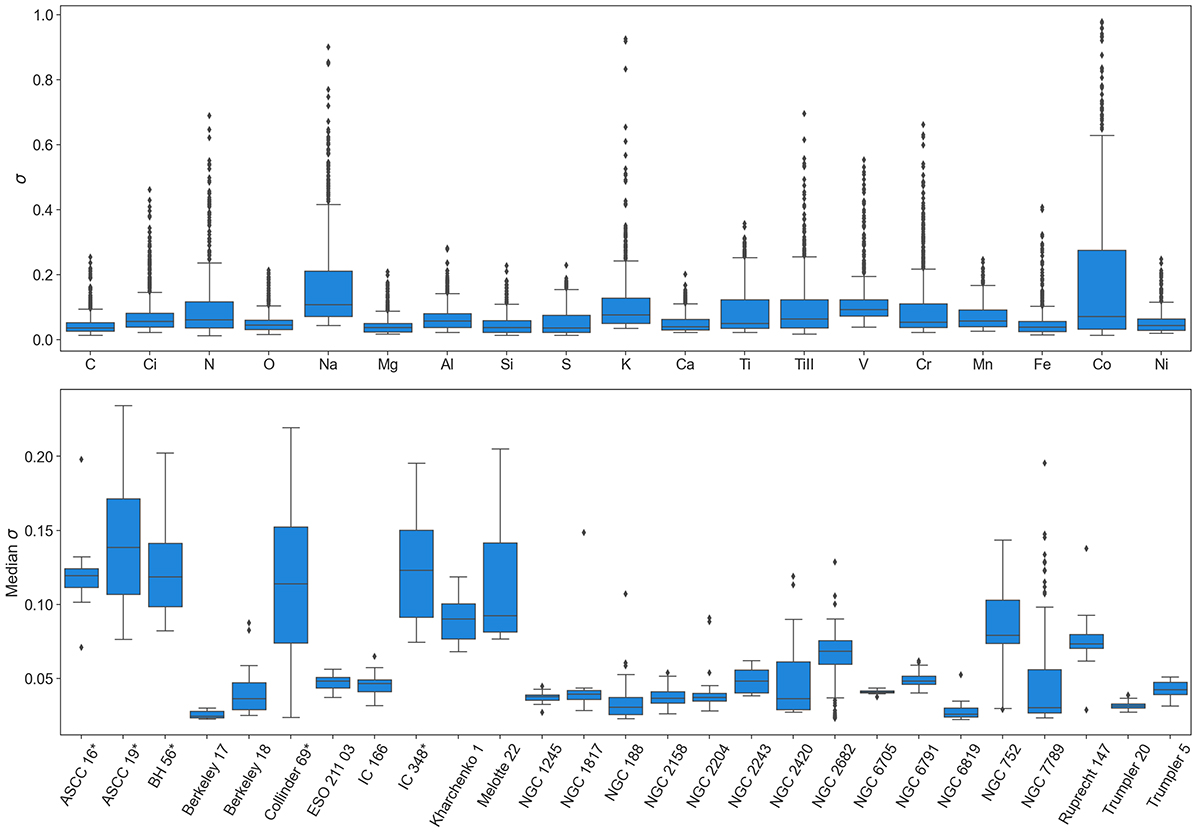
Distributions of uncertainties. Top: distribution of the abundance uncertainties of the different elements for individual stars. Bottom: distribution over cluster members of the median (over chemical abundances) uncertainties. In both panels, each box plot is relative to the group indicated in the x-axis. Each blue box and contains the middle 50% of the data, and the horizontal line within the box denotes the median value. Outliers are indicated as individual points.
Current usage metrics show cumulative count of Article Views (full-text article views including HTML views, PDF and ePub downloads, according to the available data) and Abstracts Views on Vision4Press platform.
Data correspond to usage on the plateform after 2015. The current usage metrics is available 48-96 hours after online publication and is updated daily on week days.
Initial download of the metrics may take a while.