Fig. 9
Download original image
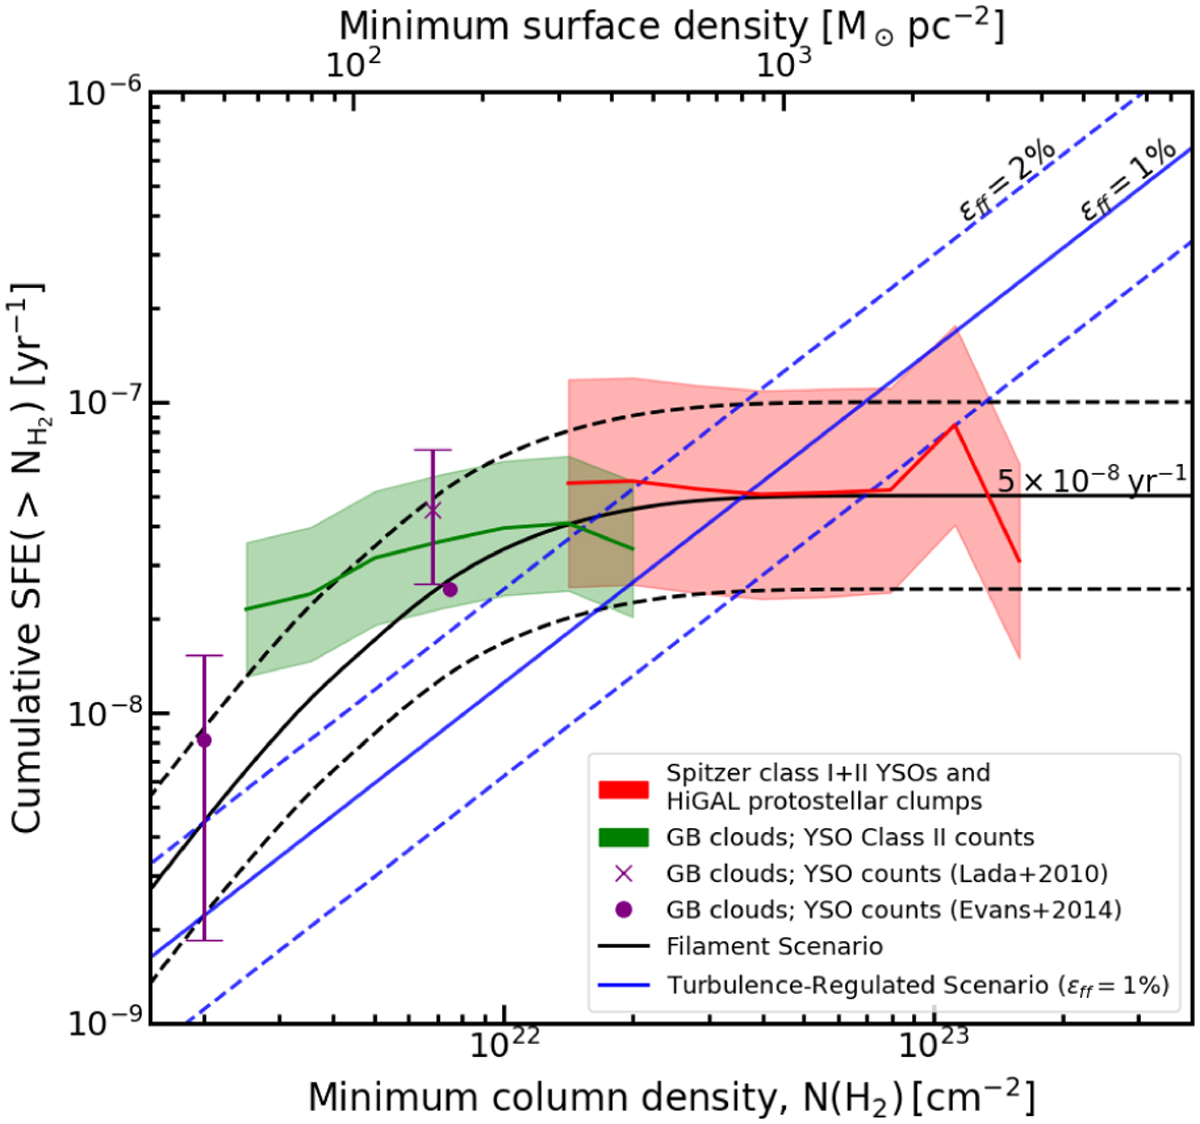
Average SFE above a minimum column density contour as a function of column density for the selected CAFFEINE (red) and nearby clouds (green). The shaded areas mark the corresponding uncertainties (cf. Eq. (8) in Sect. 5.1). For the CAFFEINE sample, the red line shows the weighted average of the two SFE estimates. The purple dots indicate averages offormerworks,where the bars show the interquartile range of each cloud sample. For comparison, the blue and black curves represent the two simple models for the SFE (єff and filament scenarios – see Sect. 6.1) and a factor 2 uncertainty. See Figs. 7 and 8 for more details on the observed SFEs.
Current usage metrics show cumulative count of Article Views (full-text article views including HTML views, PDF and ePub downloads, according to the available data) and Abstracts Views on Vision4Press platform.
Data correspond to usage on the plateform after 2015. The current usage metrics is available 48-96 hours after online publication and is updated daily on week days.
Initial download of the metrics may take a while.