Fig. 7
Download original image
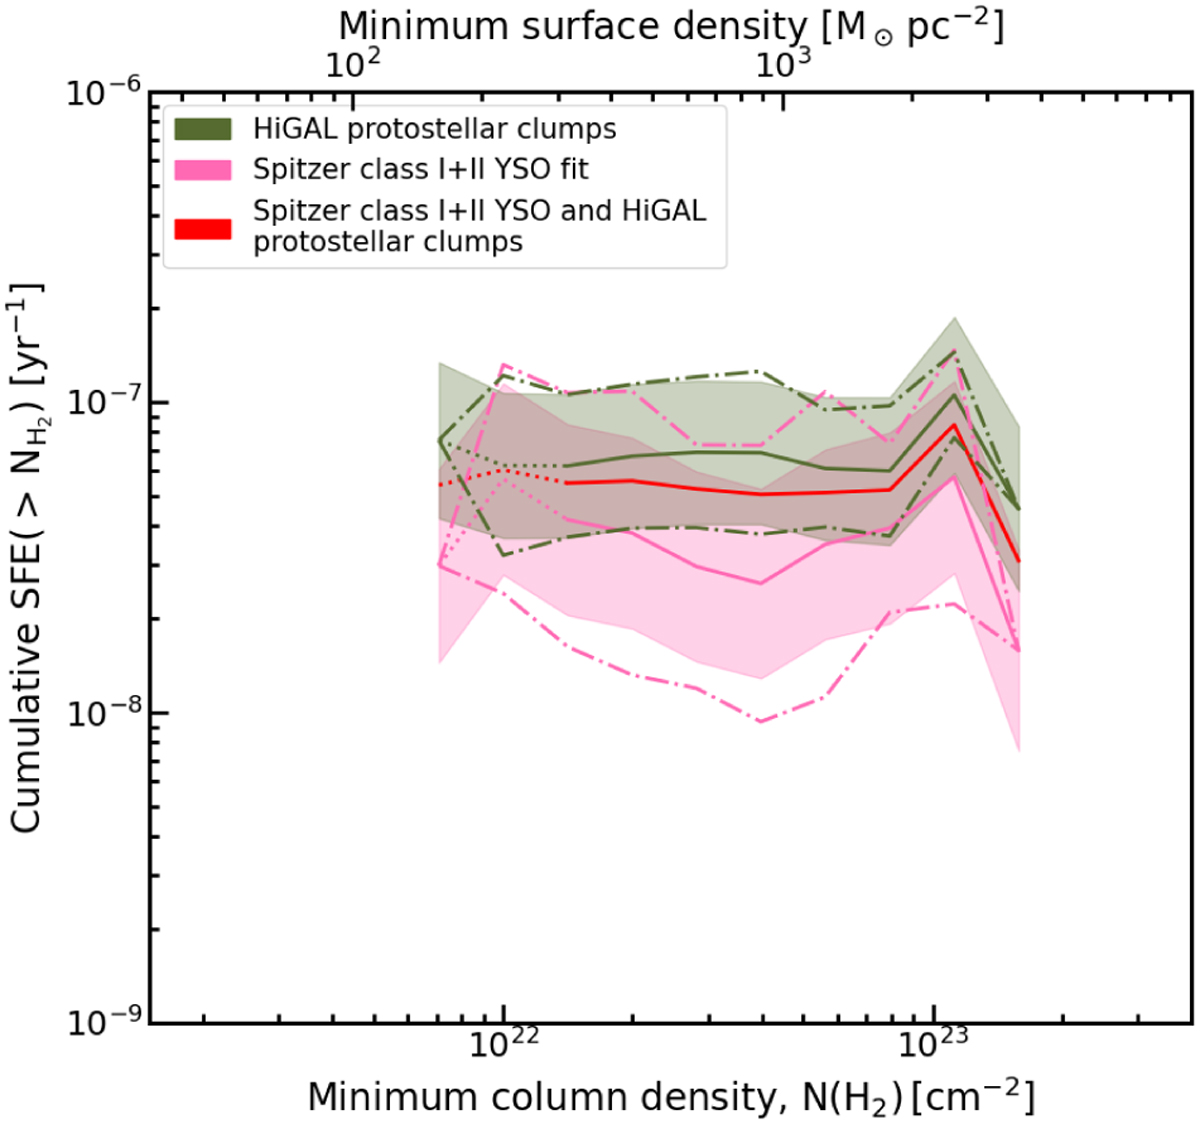
Cumulative SFE above a minimum column density ![]() contour as a function of column density for the CAFFEINE clouds. The pink and dark green curves indicate weighted averages over all significant cloud estimates above each
contour as a function of column density for the CAFFEINE clouds. The pink and dark green curves indicate weighted averages over all significant cloud estimates above each ![]() ,with SFRs derived from YSOs and Hi-GAL protostellar clumps, respectively. The shaded areas indicate the corresponding statistical uncertainties (cf. Eq. 8). The dashed-dotted lines mark the standard deviations of the sample of cloud SFE estimates above each
,with SFRs derived from YSOs and Hi-GAL protostellar clumps, respectively. The shaded areas indicate the corresponding statistical uncertainties (cf. Eq. 8). The dashed-dotted lines mark the standard deviations of the sample of cloud SFE estimates above each ![]() . The red curve marks the weighted geometric average of the two methods for estimating the SFRs and SFEs.
. The red curve marks the weighted geometric average of the two methods for estimating the SFRs and SFEs.
Current usage metrics show cumulative count of Article Views (full-text article views including HTML views, PDF and ePub downloads, according to the available data) and Abstracts Views on Vision4Press platform.
Data correspond to usage on the plateform after 2015. The current usage metrics is available 48-96 hours after online publication and is updated daily on week days.
Initial download of the metrics may take a while.