Fig. 6
Download original image
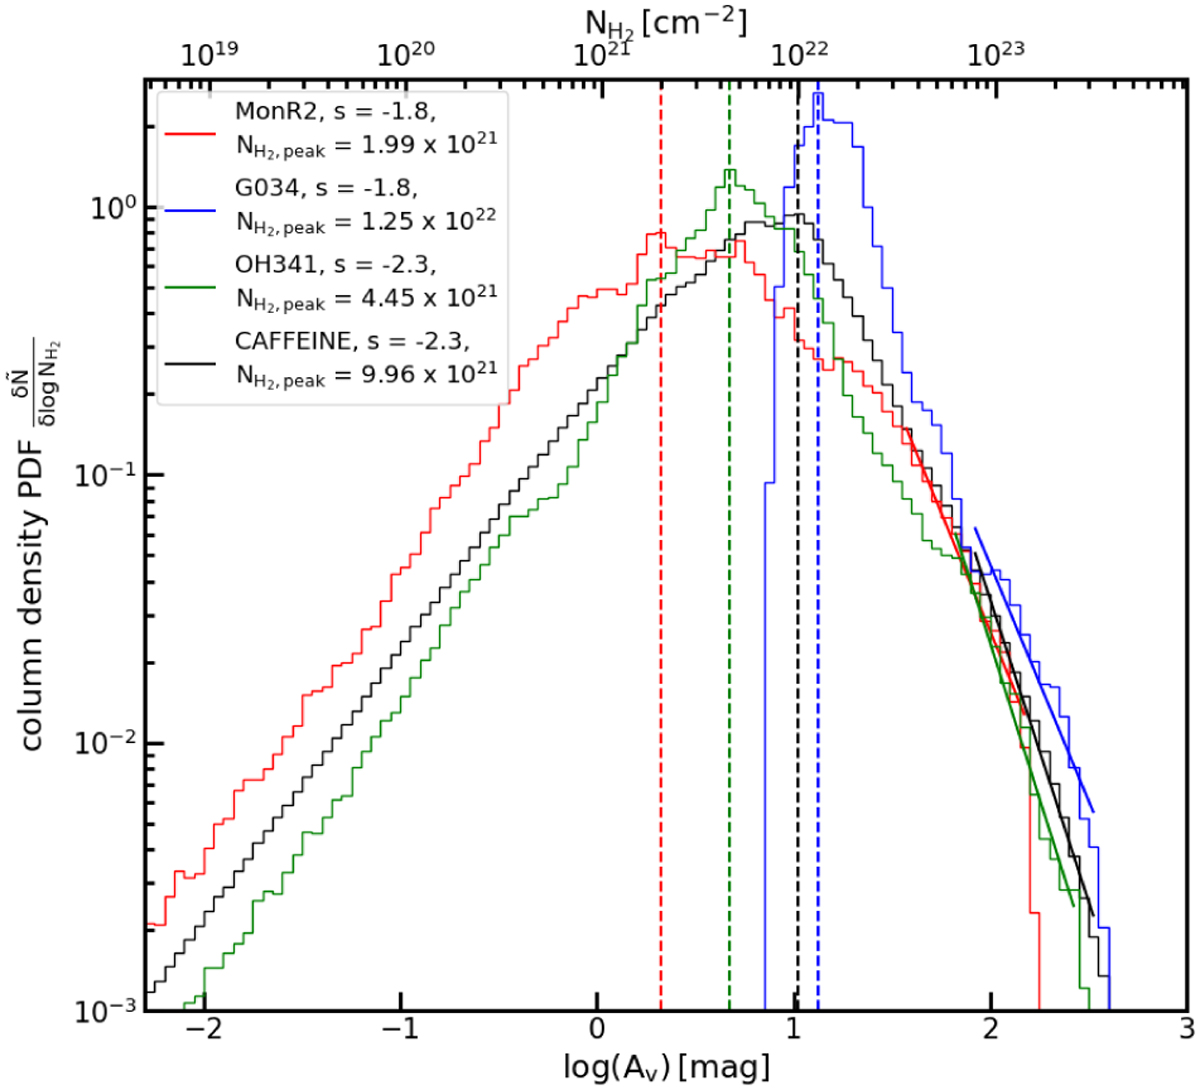
Column density probability density functions (N-PDFs) as a function of column density (top axis) and visual extinction (bottom axis) for the MonR2, G034, and OH341 regions and for all CAFFEINE regions combined in red, blue, green and black, respectively. The peaks of the distributions are indicated by dashed lines with the column density ![]() presented in the legend. Additionally, solid lines indicate the fitted power-law tail at high column densities with the slope s also mentioned in the legend.
presented in the legend. Additionally, solid lines indicate the fitted power-law tail at high column densities with the slope s also mentioned in the legend.
Current usage metrics show cumulative count of Article Views (full-text article views including HTML views, PDF and ePub downloads, according to the available data) and Abstracts Views on Vision4Press platform.
Data correspond to usage on the plateform after 2015. The current usage metrics is available 48-96 hours after online publication and is updated daily on week days.
Initial download of the metrics may take a while.