Fig. 3
Download original image
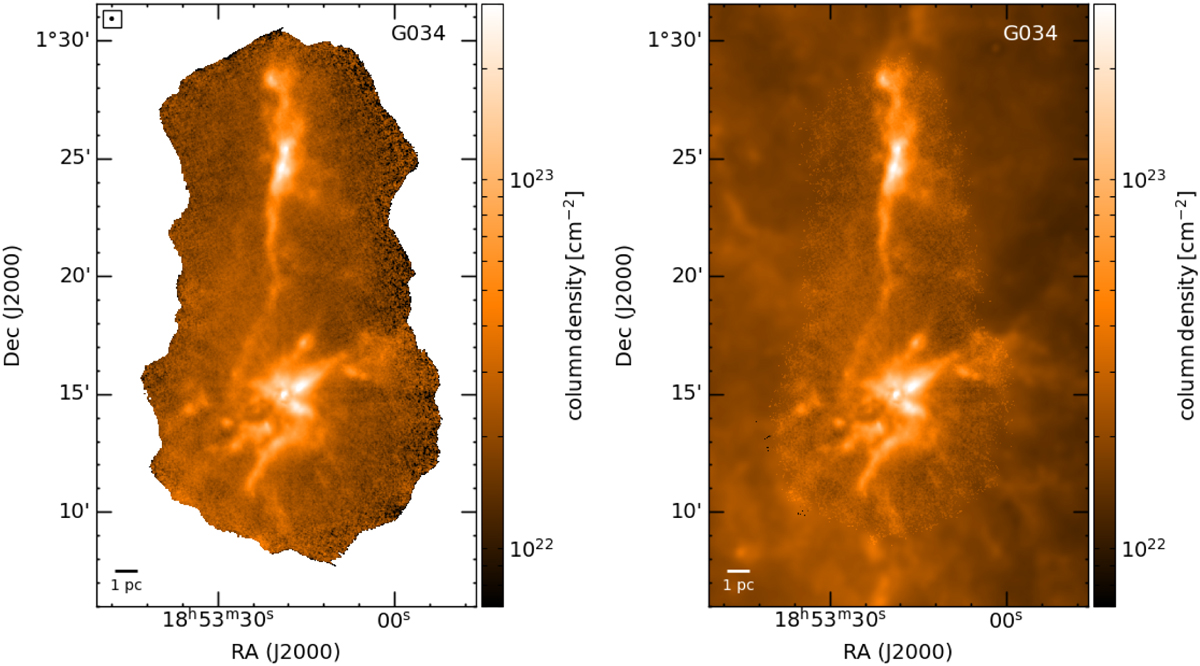
Examples of high level data products from the CAFFEINE survey. Left: column density map of the G034 region at 8″ resolution derived from combined ArTéMiS and Herschel data. Right: final multiresolution column density map of the G034 region, with 8″ resolution above ![]() ~4 × 1022 cm-2 and 18.2″ resolution at lower column densities.
~4 × 1022 cm-2 and 18.2″ resolution at lower column densities.
Current usage metrics show cumulative count of Article Views (full-text article views including HTML views, PDF and ePub downloads, according to the available data) and Abstracts Views on Vision4Press platform.
Data correspond to usage on the plateform after 2015. The current usage metrics is available 48-96 hours after online publication and is updated daily on week days.
Initial download of the metrics may take a while.