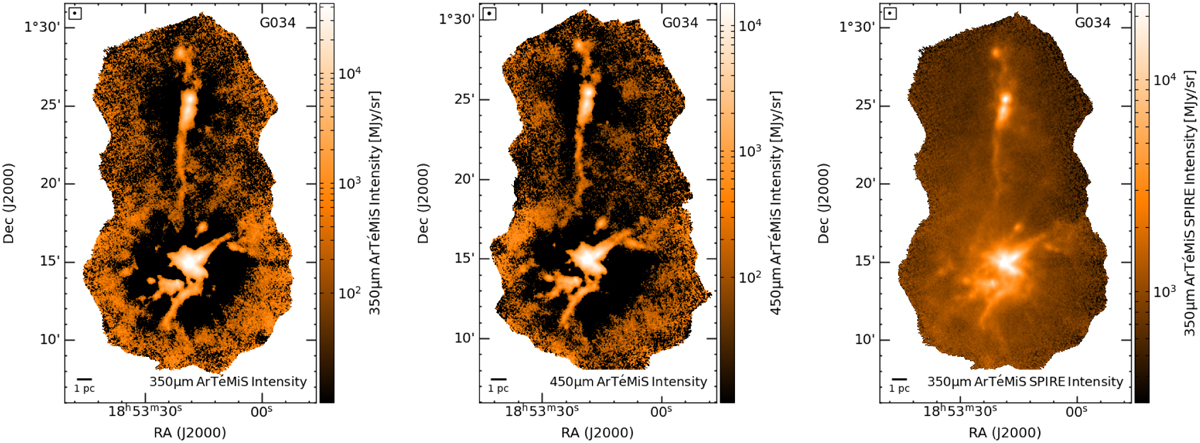
Fig. 2
Download original image
Examples of data products derived from the CAFFEINE survey. Left: dust continuum emission of the G034 region as observed at 350 µm by ArTéMiS at 8″ resolution. Center: dust continuum emission of the G034 region as observed at 450 µm by ArTéMiS at 10" resolution. Right: combined 350 µm ArTéMiS-SPIRE dust continuum emission map with 8" resolution and high dynamic range.
Current usage metrics show cumulative count of Article Views (full-text article views including HTML views, PDF and ePub downloads, according to the available data) and Abstracts Views on Vision4Press platform.
Data correspond to usage on the plateform after 2015. The current usage metrics is available 48-96 hours after online publication and is updated daily on week days.
Initial download of the metrics may take a while.