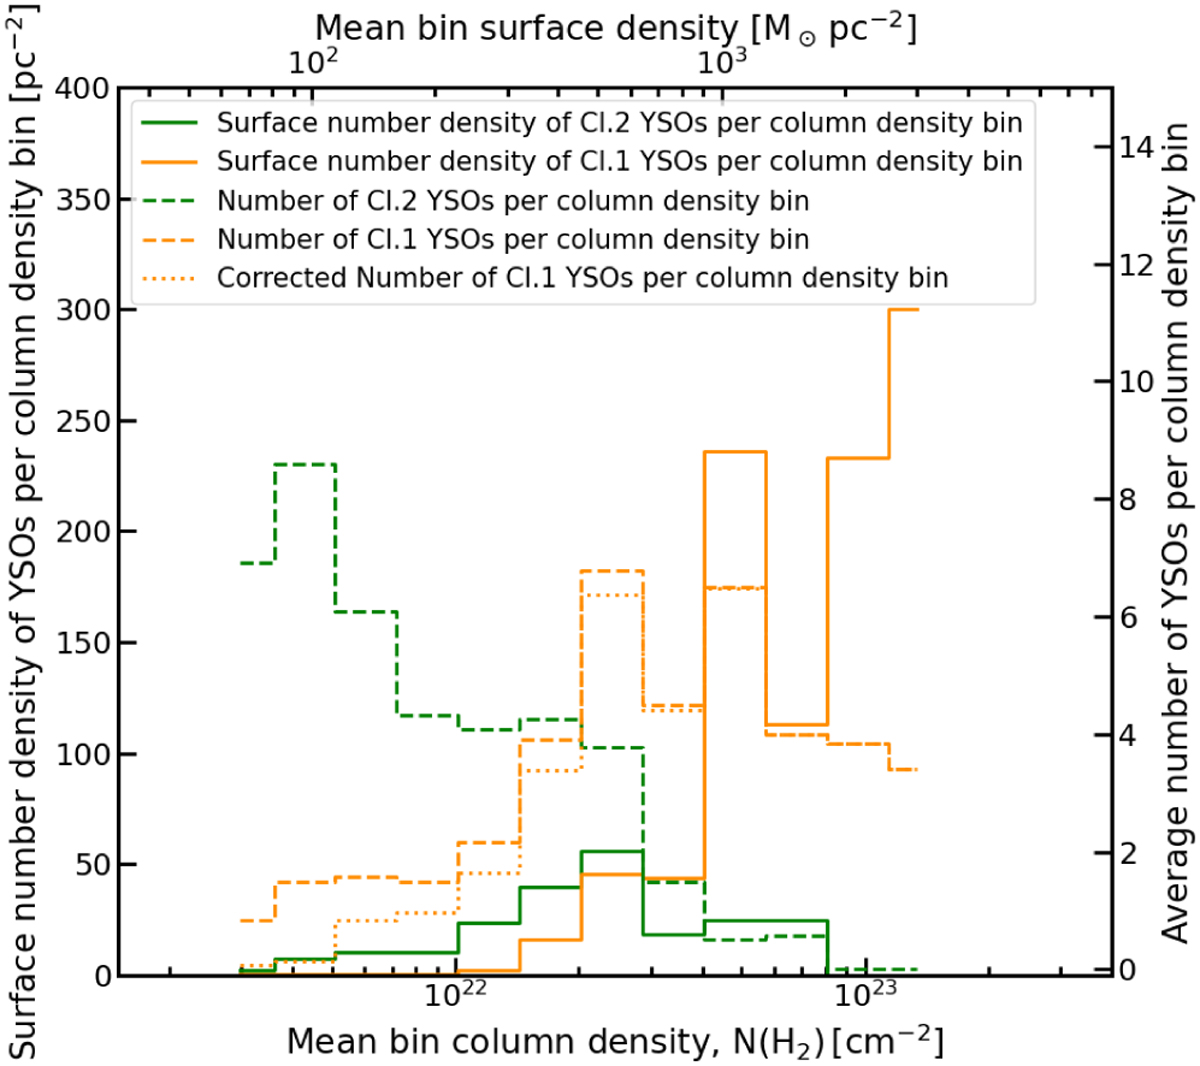
Fig. A.2
Download original image
Average number statistics of Class I (orange) and Class II (green) YSOs for the nearby clouds considered in this study. The solid histograms show the surface number densities in each column density bin (left axis), while the dashed and dotted histograms give the numbers of objects ineachcolumndensitybin(rightaxis). The dashed and dotted orange histograms show the number sof Class I objects per bin before and after correction for contamination by the fraction of Class I sources with no significant protostellar envelope (cf. Sect. 5.3 and Heiderman & Evans 2015), respectively.
Current usage metrics show cumulative count of Article Views (full-text article views including HTML views, PDF and ePub downloads, according to the available data) and Abstracts Views on Vision4Press platform.
Data correspond to usage on the plateform after 2015. The current usage metrics is available 48-96 hours after online publication and is updated daily on week days.
Initial download of the metrics may take a while.