Open Access
Fig. 12
Download original image
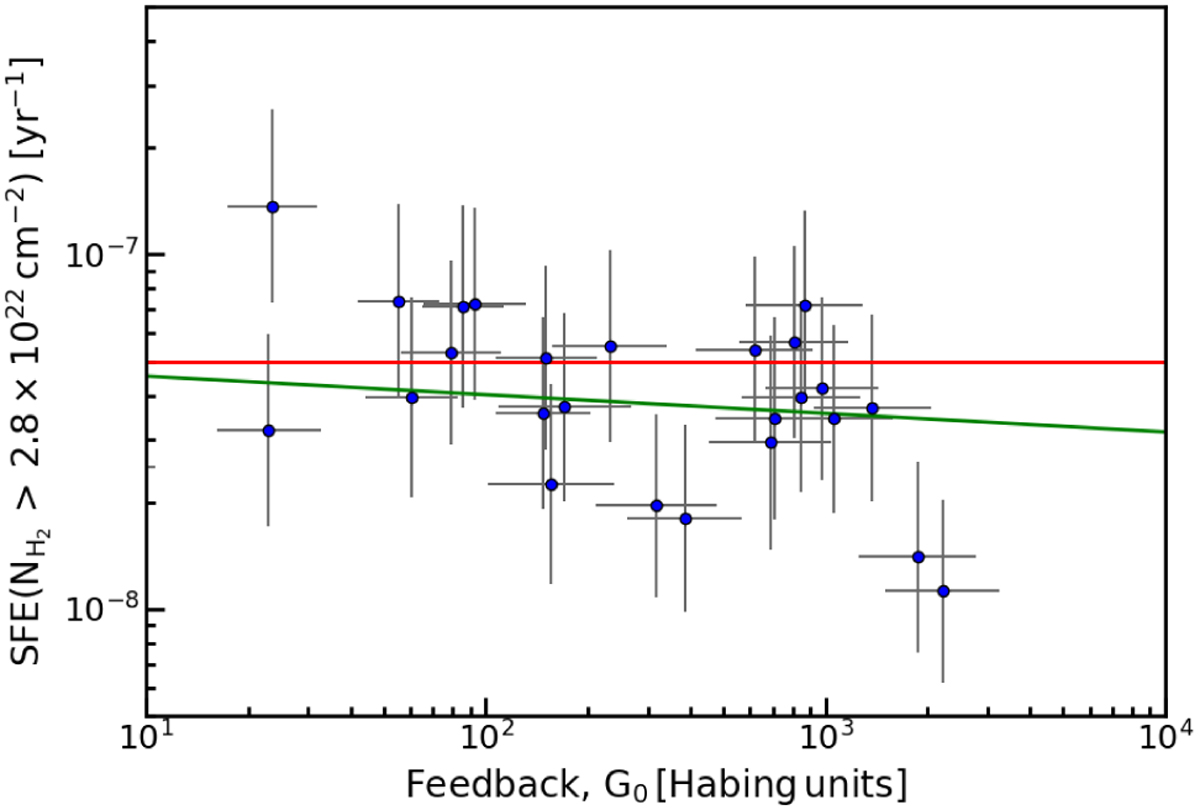
Cumulative SFE above ![]() > 2.8 × 1022 cm−2 against the 90th percentile of FUV flux over the region observed by CAFFEINE. The red line indicates the SFE predicted by the filament scenario and the green line shows the result of a fitted power-law with a slope of −0.05 ± 0.05 and a p-value of 0.34.
> 2.8 × 1022 cm−2 against the 90th percentile of FUV flux over the region observed by CAFFEINE. The red line indicates the SFE predicted by the filament scenario and the green line shows the result of a fitted power-law with a slope of −0.05 ± 0.05 and a p-value of 0.34.
Current usage metrics show cumulative count of Article Views (full-text article views including HTML views, PDF and ePub downloads, according to the available data) and Abstracts Views on Vision4Press platform.
Data correspond to usage on the plateform after 2015. The current usage metrics is available 48-96 hours after online publication and is updated daily on week days.
Initial download of the metrics may take a while.