Fig. 10
Download original image
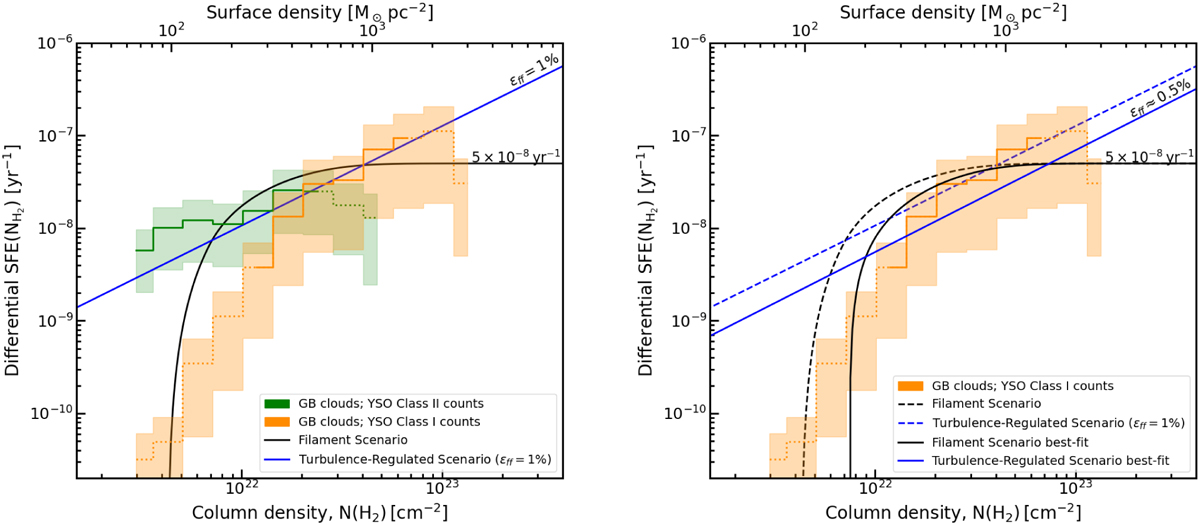
Differential SFE per column density bin from YSO-counting in nearby clouds vs. column density compared to both the filament or transition model (black curve) and the ϵff model (blue line). Left: comparison of both Class I-based (orange shading) and Class II-based (green shading) SFE estimates with the nominal models discussed in Sect. 6.1. Right: comparison of the Class I-based SFE estimates (orange shading) with the “best-fit” transition and ϵff models (black and blue solid lines, see text). The nominal models shown in the left panel are displayed as dashed lines.
Current usage metrics show cumulative count of Article Views (full-text article views including HTML views, PDF and ePub downloads, according to the available data) and Abstracts Views on Vision4Press platform.
Data correspond to usage on the plateform after 2015. The current usage metrics is available 48-96 hours after online publication and is updated daily on week days.
Initial download of the metrics may take a while.