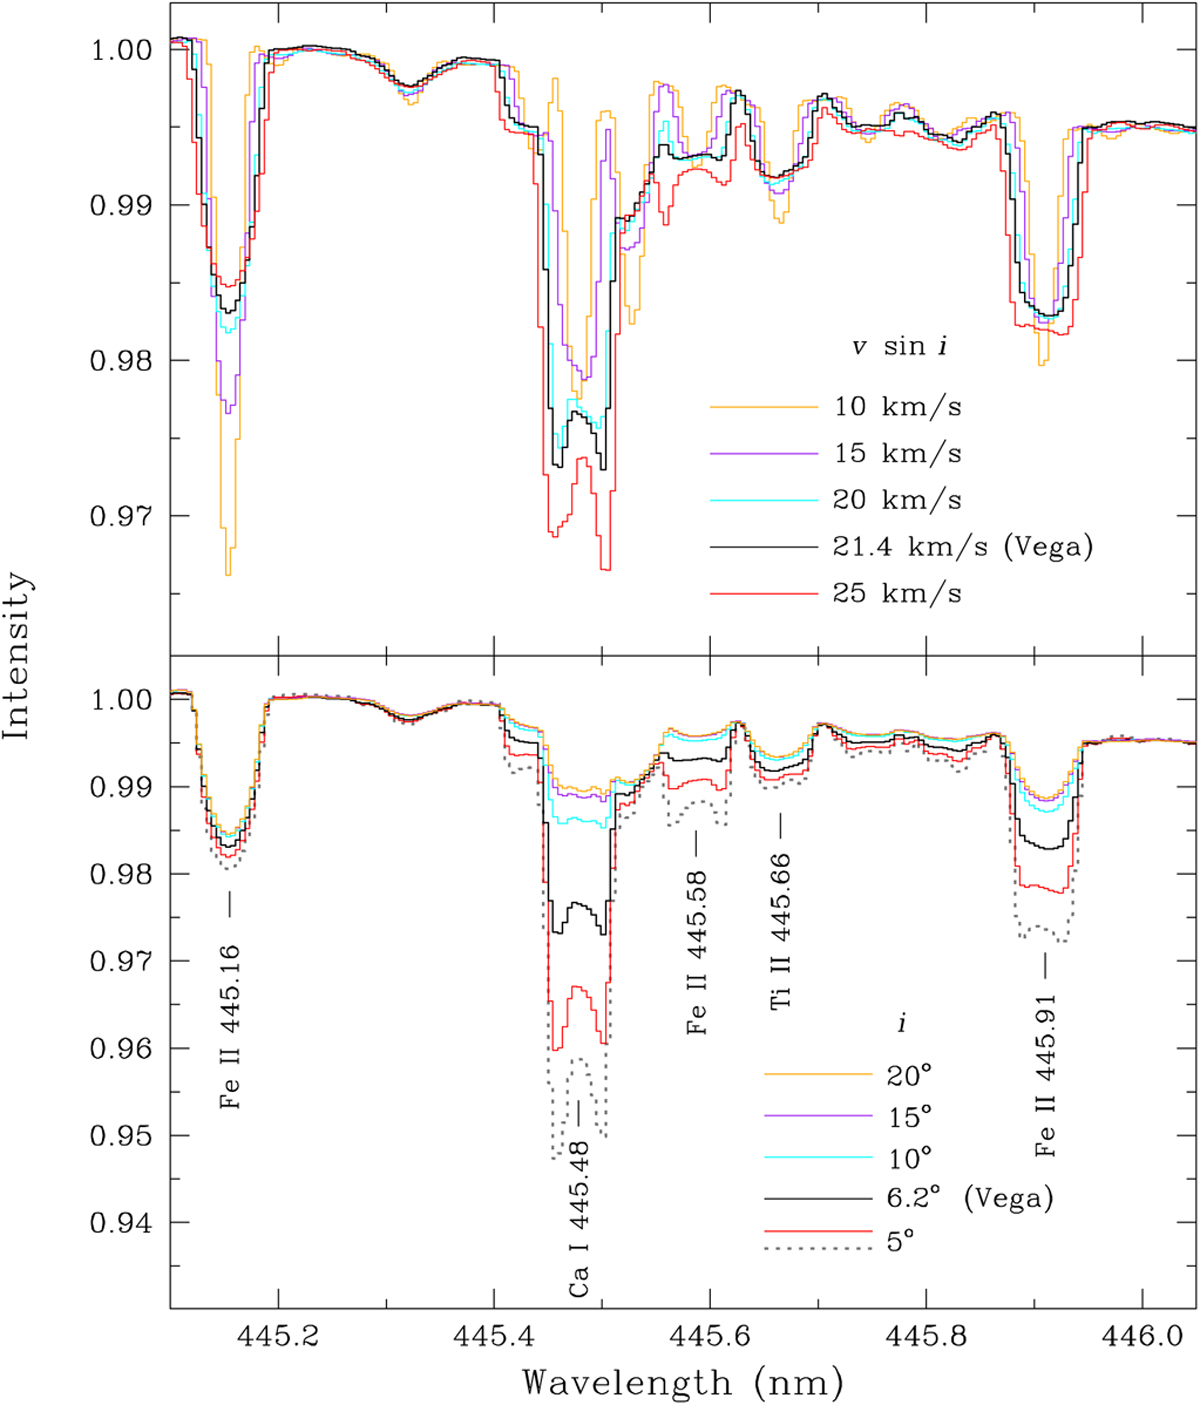
Fig. 6
Download original image
Models of a small section of the optical spectrum showing the variations in the spectral lines with υeq sin i for a fixed inclination (upper panel), and with the inclination, i, for a fixed value of υeq sin i. The parameters of the models are given in Table 2. We note that the profile of the Ca I 445.48 nm line, which appears in Figs. 4 and 5, and that of the Fe II 445.16 nm, which also appears in Fig. 5, are scaled in those figures to an intensity at the bottom of ~0.9 for plotting purposes. In this figure, all three lines show their actual relative intensities.
Current usage metrics show cumulative count of Article Views (full-text article views including HTML views, PDF and ePub downloads, according to the available data) and Abstracts Views on Vision4Press platform.
Data correspond to usage on the plateform after 2015. The current usage metrics is available 48-96 hours after online publication and is updated daily on week days.
Initial download of the metrics may take a while.