Fig. 4
Download original image
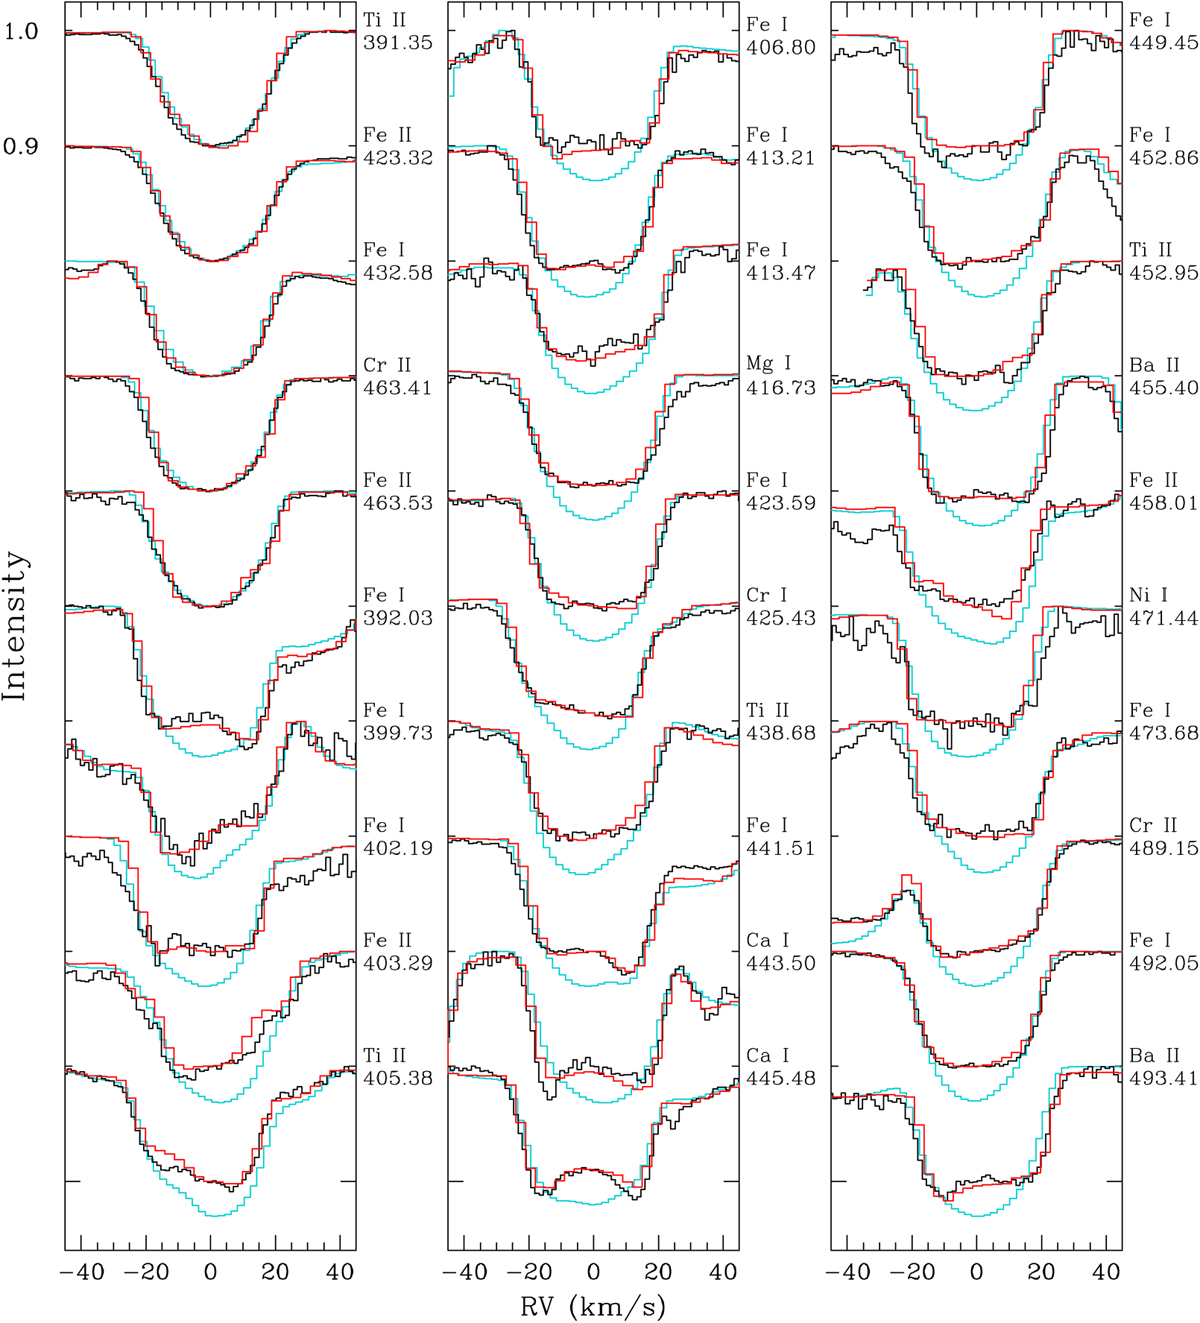
Plotted in black, profiles of 30 absorption features of the spectrum of Vega from different species. Superimposed on the observed lines are the results of the spectral synthesis described in Sect. 4, and the spectral single-T, single-log g synthesis carried out with the values of ![]() and log
and log ![]() , listed in Table 1, plotted in red and light blue, respectively (see the text for further details).
, listed in Table 1, plotted in red and light blue, respectively (see the text for further details).
Current usage metrics show cumulative count of Article Views (full-text article views including HTML views, PDF and ePub downloads, according to the available data) and Abstracts Views on Vision4Press platform.
Data correspond to usage on the plateform after 2015. The current usage metrics is available 48-96 hours after online publication and is updated daily on week days.
Initial download of the metrics may take a while.