Fig. 9.
Download original image
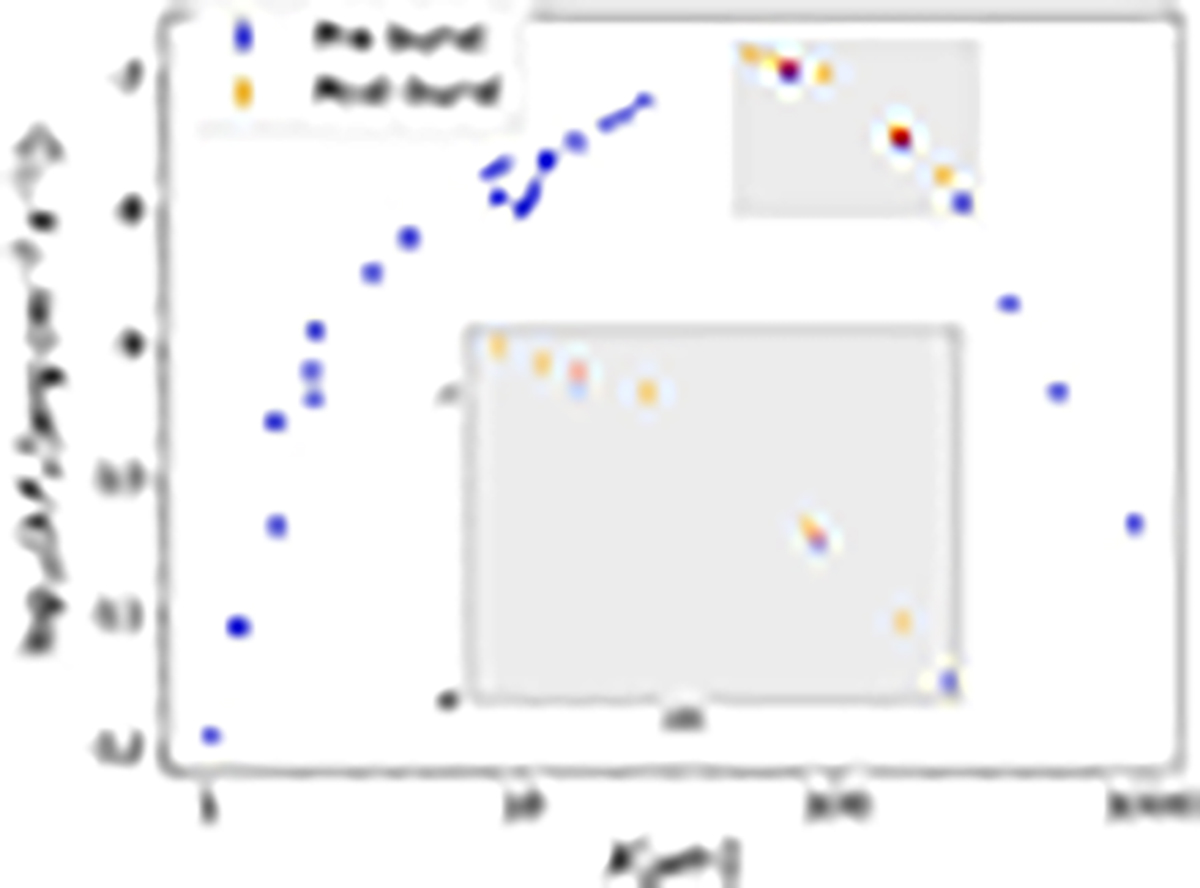
Pre-burst SED (blue), together with the HAWC+ post-burst observations (orange). The HAWC+ observations were interpolated to match the wavelengths of the pre-burst observation. The resulting data points are colored red. The inset shows a zoom-in on the region of interest. The flux excess in the post-burst epoch is small (only ∼10% at 70, 160 μm).
Current usage metrics show cumulative count of Article Views (full-text article views including HTML views, PDF and ePub downloads, according to the available data) and Abstracts Views on Vision4Press platform.
Data correspond to usage on the plateform after 2015. The current usage metrics is available 48-96 hours after online publication and is updated daily on week days.
Initial download of the metrics may take a while.