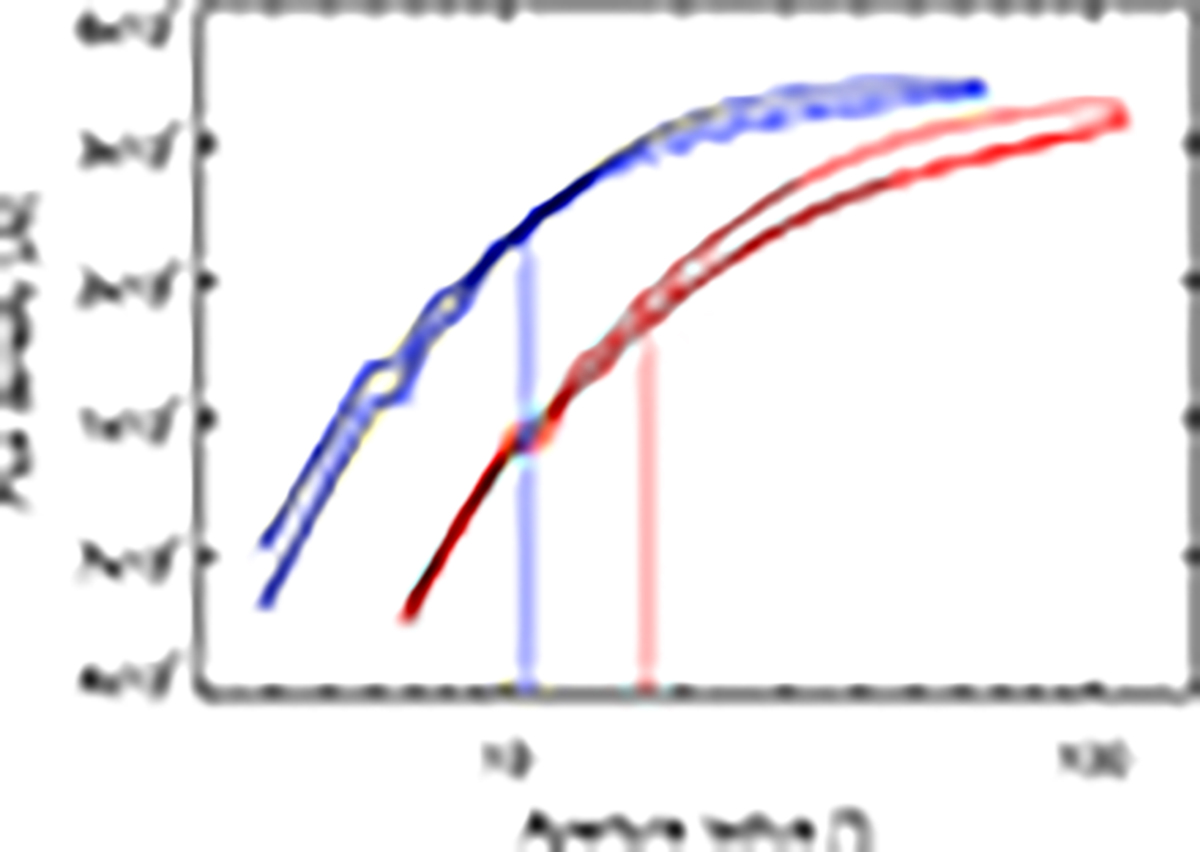
Fig. 8.

Download original image
Flux growth curves of PACS (dashed) and HAWC+ (solid). The wavelength bands are indicated by color, where blue is 62/70 and red 154/160 μm for HAWC+/PACS, respectively. The vertical lines mark the aperture radii, which reproduce the HPPSC fluxes. Black lines are polynomial approximations, reducing the influence of finite pixel size. The mean of the growth curve ratios gives the increase at the HAWC+ epoch.
Current usage metrics show cumulative count of Article Views (full-text article views including HTML views, PDF and ePub downloads, according to the available data) and Abstracts Views on Vision4Press platform.
Data correspond to usage on the plateform after 2015. The current usage metrics is available 48-96 hours after online publication and is updated daily on week days.
Initial download of the metrics may take a while.


