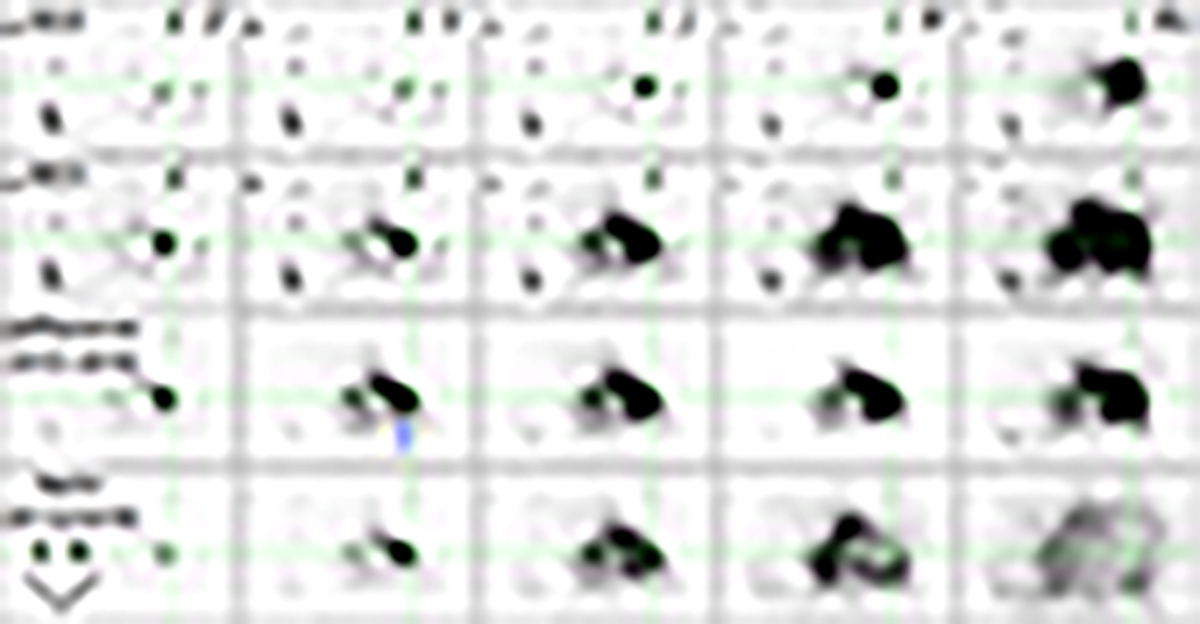
Fig. 5.
Download original image
Columns from left to right: Z, Y, J, H, and Ks images and rows from top to bottom: those of 2010, 2015, difference, and ratio (range 0…17.5). The crosshair marks the MYSO position. For the upper two rows, the values comprise 98 percentiles, displayed using a linear stretch. At red optical wavelengths (two leftmost columns), the object appears bipolar. Both blobs are probably due to scattering, with the eastern one brighter in Z. Both are offset from the nominal MYSO position and indicated by the red Z contours in Fig. 10. The prompt LE is visible in all five bands. Its large size in the Ks ratio image is due to a smaller number of scatterings compared to the other bands. A common foreground proper motion binary (blue arrow) appears in Z and J next to G323. The FoV amounts to 70″ × 45″.
Current usage metrics show cumulative count of Article Views (full-text article views including HTML views, PDF and ePub downloads, according to the available data) and Abstracts Views on Vision4Press platform.
Data correspond to usage on the plateform after 2015. The current usage metrics is available 48-96 hours after online publication and is updated daily on week days.
Initial download of the metrics may take a while.