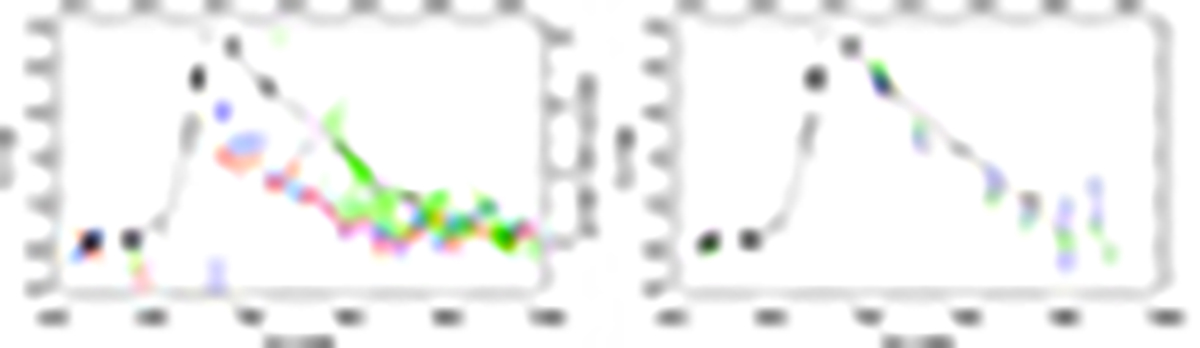
Fig. 4.
Download original image
Left: light curves based on VVV(X) (black) and (NEO)WISE photometry (W1 – blue, and W2 – red) as well as 6.7 GHz total maser flux (green, Green et al. 2015; MacLeod et al. 2021). Vertical red and blue lines mark the dates of the burst onset and first flare evidence from the 6.035 GHz exOH maser (MacLeod et al. 2021). The Ks rise was approximated by a polynomial, while its decay is roughly linear on a log scale (dashed line). The (NEO)WISE magnitudes are shifted to match those of Ks. The integrated maser flux is shown on a log scale (right ordinate). Its scatter is due to the short-term periodicity. Right: Ks (black), i (blue), and z (green) light curves, with i and z magnitudes shifted to match those of Ks. The z pre- and post-magnitudes agree within the errors.
Current usage metrics show cumulative count of Article Views (full-text article views including HTML views, PDF and ePub downloads, according to the available data) and Abstracts Views on Vision4Press platform.
Data correspond to usage on the plateform after 2015. The current usage metrics is available 48-96 hours after online publication and is updated daily on week days.
Initial download of the metrics may take a while.