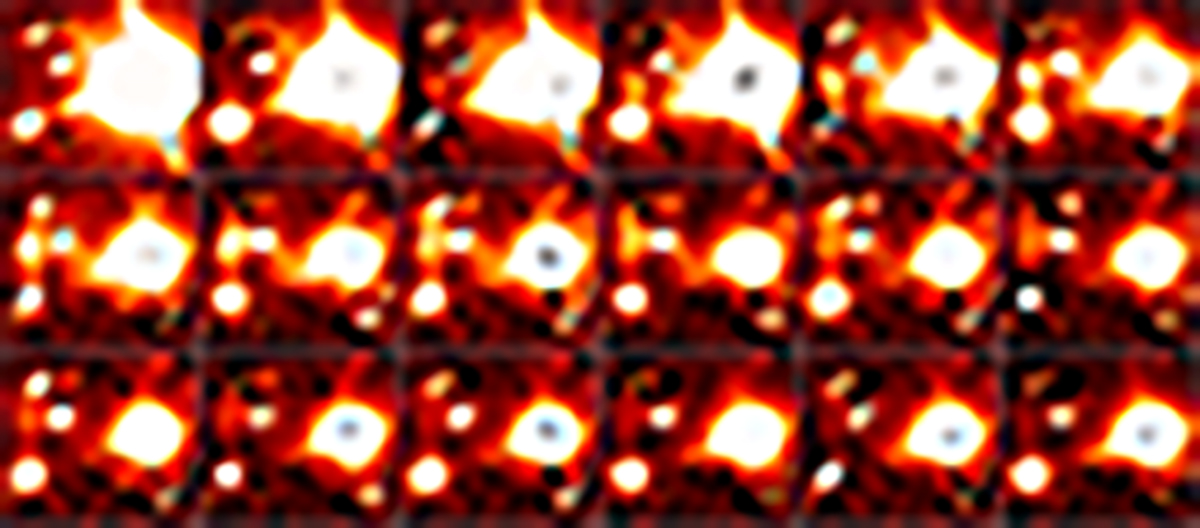
Fig. A.1.
Download original image
Evolution of the remote LE (left border) in the W1 band, illustrated by bi-annual difference images that were created by subtracting those from 2014. FoV and orientation correspond to Fig. 6. Each row covers three years, starting on top left in early 2015. The W2 images look similar. A few variable stars are present as well.
Current usage metrics show cumulative count of Article Views (full-text article views including HTML views, PDF and ePub downloads, according to the available data) and Abstracts Views on Vision4Press platform.
Data correspond to usage on the plateform after 2015. The current usage metrics is available 48-96 hours after online publication and is updated daily on week days.
Initial download of the metrics may take a while.