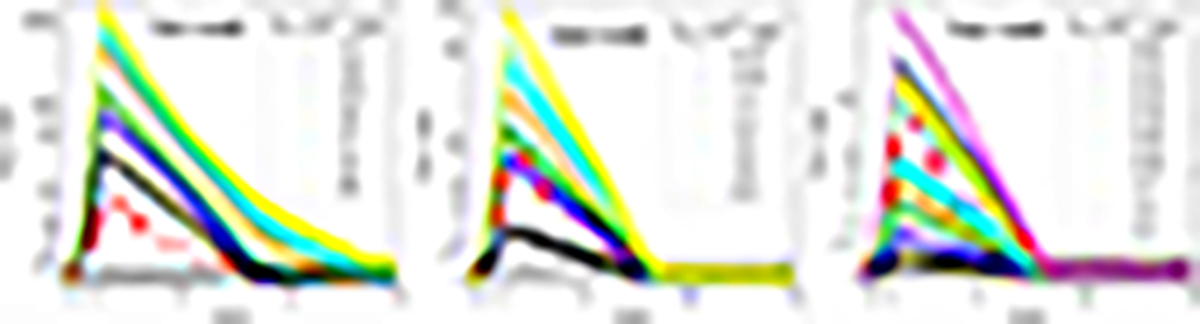
Fig. 21.
Download original image
Modeled Ks ratio curve for the Tmin (left), mean (middle), and Tmax (right) model setups featuring different bursts (in 1047 erg, color-coded). The observed Ks increase is shown in red for comparison. The ratio depends more on the energy input than on the setting. The best agreement is reached for Eacc = 0.93 × 1047 erg. For the Tmin setting and the highest burst energies, the Ks curves decay delayed, this might be an artifact due to the innermost dust becoming unrealistically hot (rmin is fixed to 60 au, that is, 3 × Rsub). We note that the ordinate scales are different.
Current usage metrics show cumulative count of Article Views (full-text article views including HTML views, PDF and ePub downloads, according to the available data) and Abstracts Views on Vision4Press platform.
Data correspond to usage on the plateform after 2015. The current usage metrics is available 48-96 hours after online publication and is updated daily on week days.
Initial download of the metrics may take a while.