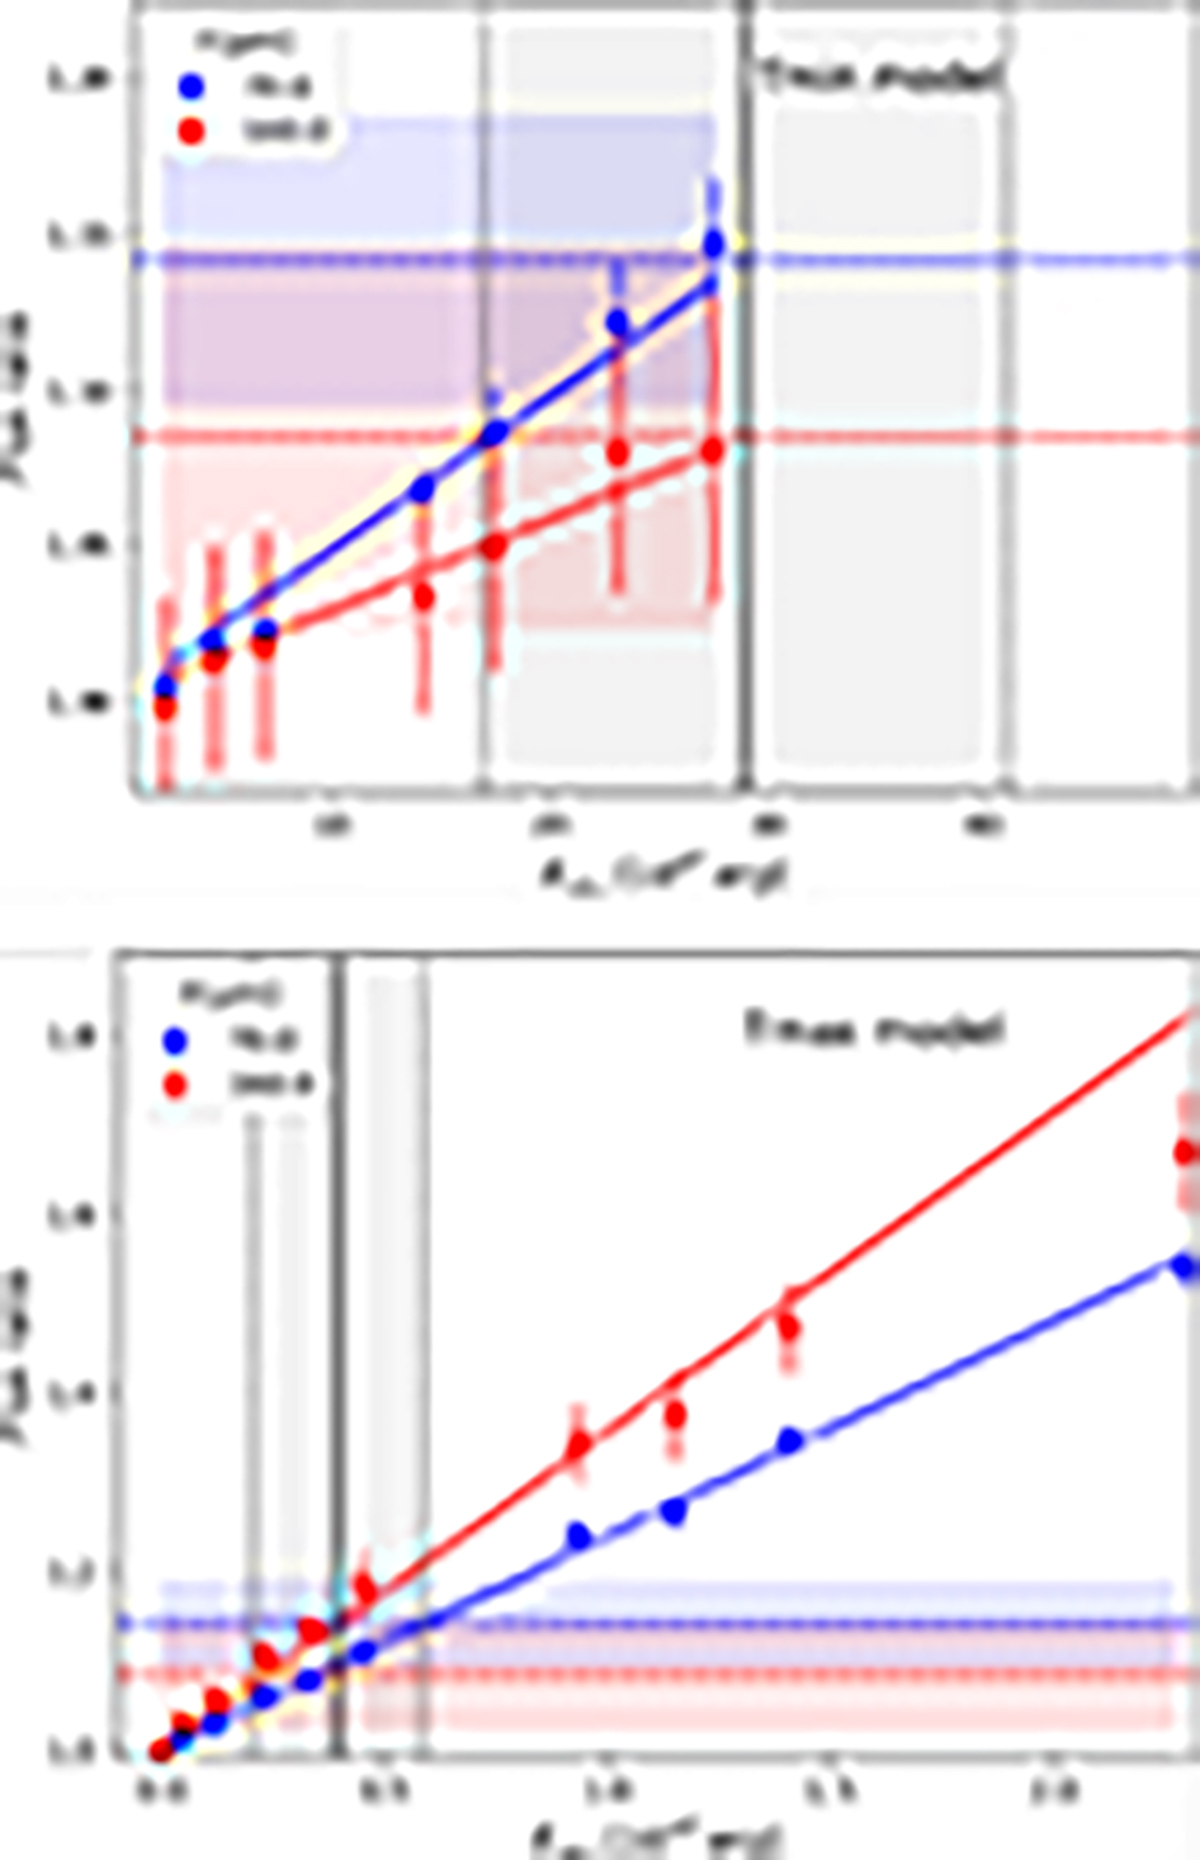
Fig. 20.
Download original image
Same as Fig. 18, but for the Tmin and Tmax model (top and bottom, respectively). For these settings, the burst energy (indicated by the vertical black line) needed to explain the HAWC+ data (horizontal red and blue lines) is maximized or minimized respectively. Interestingly, for the Tmax setting, which is the most extended and densest, the flux ratio at 160 μm (red) exceeds that at 70 μm (blue). The dependency is almost linear. The best fits are indicated by the solid colored lines. Note the different scales.
Current usage metrics show cumulative count of Article Views (full-text article views including HTML views, PDF and ePub downloads, according to the available data) and Abstracts Views on Vision4Press platform.
Data correspond to usage on the plateform after 2015. The current usage metrics is available 48-96 hours after online publication and is updated daily on week days.
Initial download of the metrics may take a while.