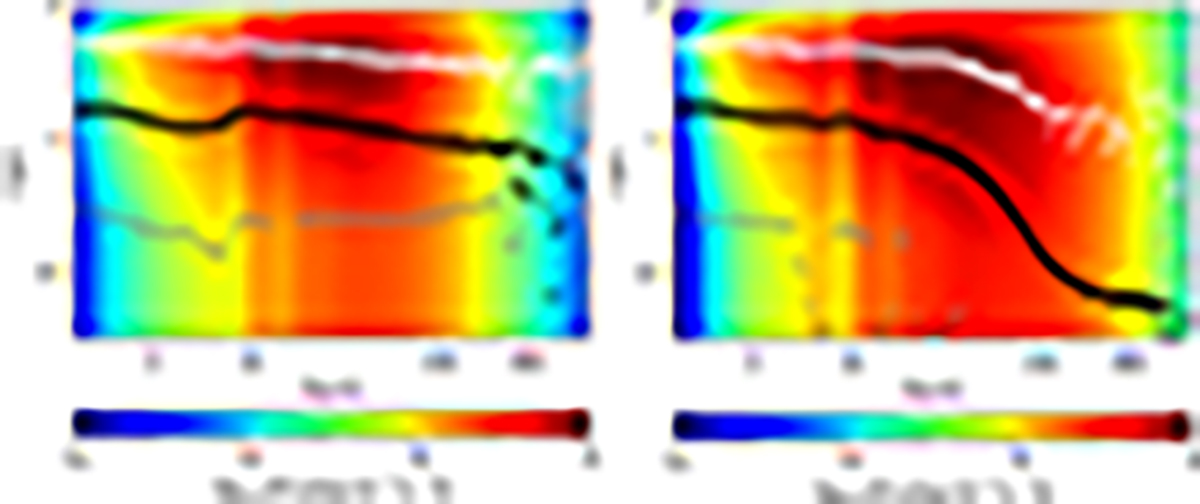
Fig. 19.
Download original image
Same as Fig. 16 but for the Tmin (left) and Tmax (right) setting. The burst is the same for both. The plot shows that the dust distribution strongly imprints the afterglow. For denser and more extended envelopes, the MIR/FIR afterglow can be significantly longer. Horizontal lines indicate the times when the peak is reached (white triangles), when 80% of the energy is released (black dots), and the time when the flux density is back at 1.25 × Lpre(λ) (gray).
Current usage metrics show cumulative count of Article Views (full-text article views including HTML views, PDF and ePub downloads, according to the available data) and Abstracts Views on Vision4Press platform.
Data correspond to usage on the plateform after 2015. The current usage metrics is available 48-96 hours after online publication and is updated daily on week days.
Initial download of the metrics may take a while.