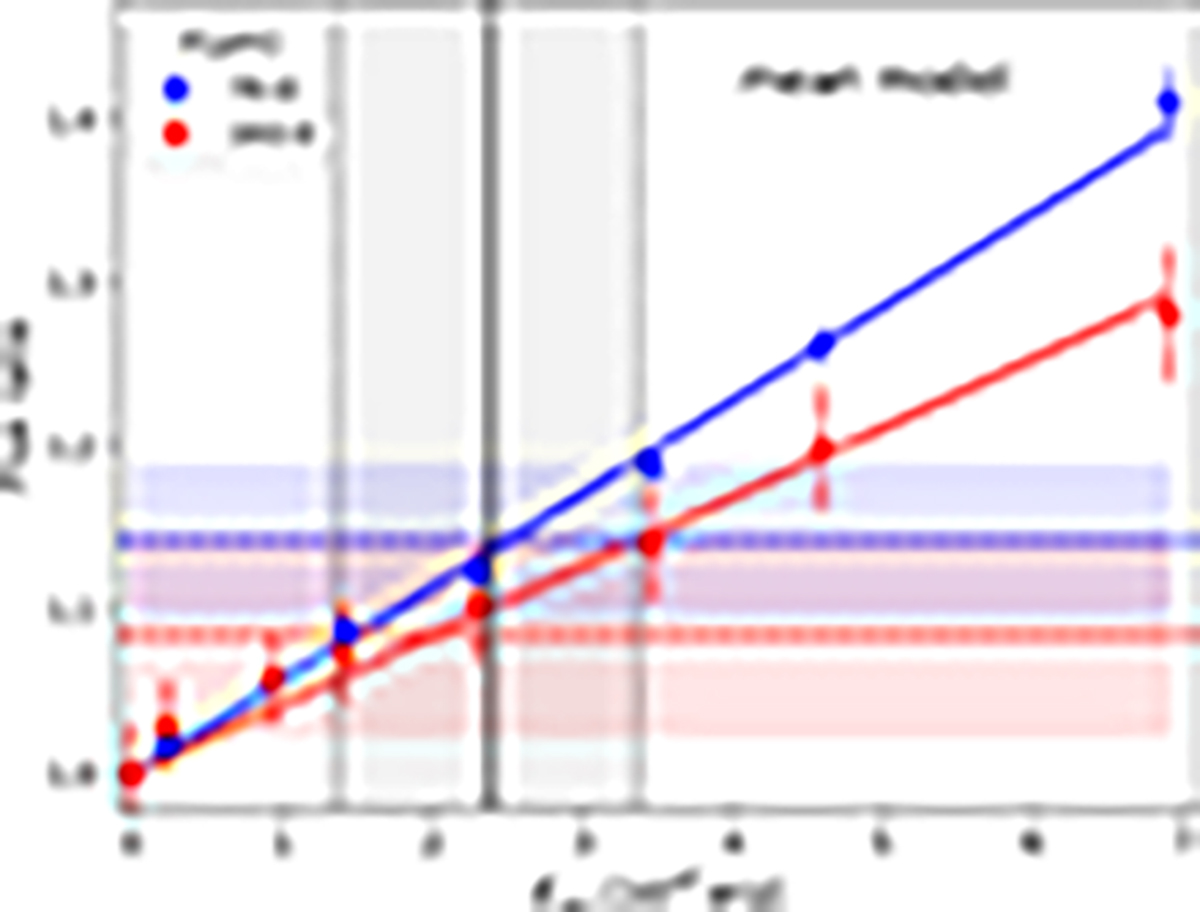
Fig. 18.
Download original image
Modeled flux ratio at 70 (blue) and 160 μm (red dots) for different burst energies, all featuring the mean setting. Solid lines are linear fits. The dashed horizontal lines are the observations with confidence intervals (overlapping colored areas). The vertical black line indicates the best burst energy Eacc for both wavelengths. The 1σ-confidence interval is indicated. We use a χ2-minimization to determine Eacc, where we use linear fits (colored solid lines) as model values for both wavelengths. We take into account the observational errors and uncertainties of the modeled ratios, where the contribution of the latter is minor.
Current usage metrics show cumulative count of Article Views (full-text article views including HTML views, PDF and ePub downloads, according to the available data) and Abstracts Views on Vision4Press platform.
Data correspond to usage on the plateform after 2015. The current usage metrics is available 48-96 hours after online publication and is updated daily on week days.
Initial download of the metrics may take a while.