Fig. 17.
Download original image
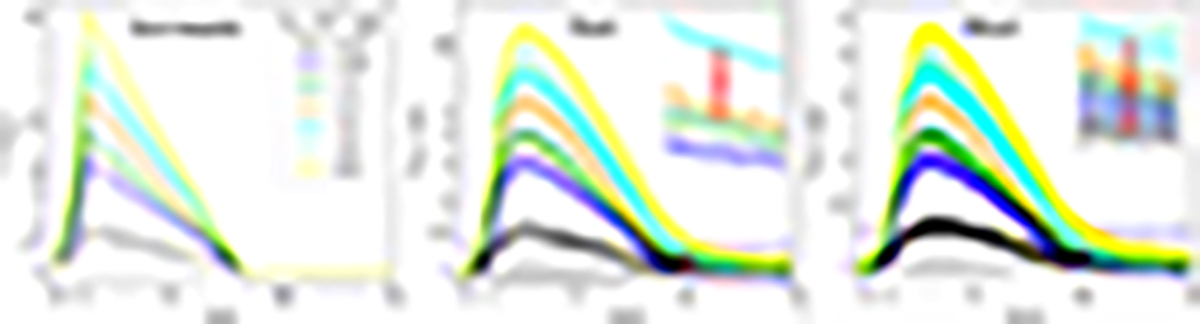
Input burst profiles (left) and output flux ratios as a function of time for 70 (middle) and 160 μm (right) for the mean model. The burst energy is varied between (0.23 and 6.9)×1047 erg (color-coded). Obviously, the afterglows are longer for more energetic bursts. The geometry is the same for all simulations. The HAWC+ measurements are colored red. The horizontal solid and dashed-dotted lines mark the pre-burst level and 1.25 times that level. The insets show a zoom-in on the region of interest. The simulations (colored dots) were interpolated in time to reduce numerical scatter (corresponding lines and shaded regions). The observations are given in red.
Current usage metrics show cumulative count of Article Views (full-text article views including HTML views, PDF and ePub downloads, according to the available data) and Abstracts Views on Vision4Press platform.
Data correspond to usage on the plateform after 2015. The current usage metrics is available 48-96 hours after online publication and is updated daily on week days.
Initial download of the metrics may take a while.