Fig. 16.
Download original image
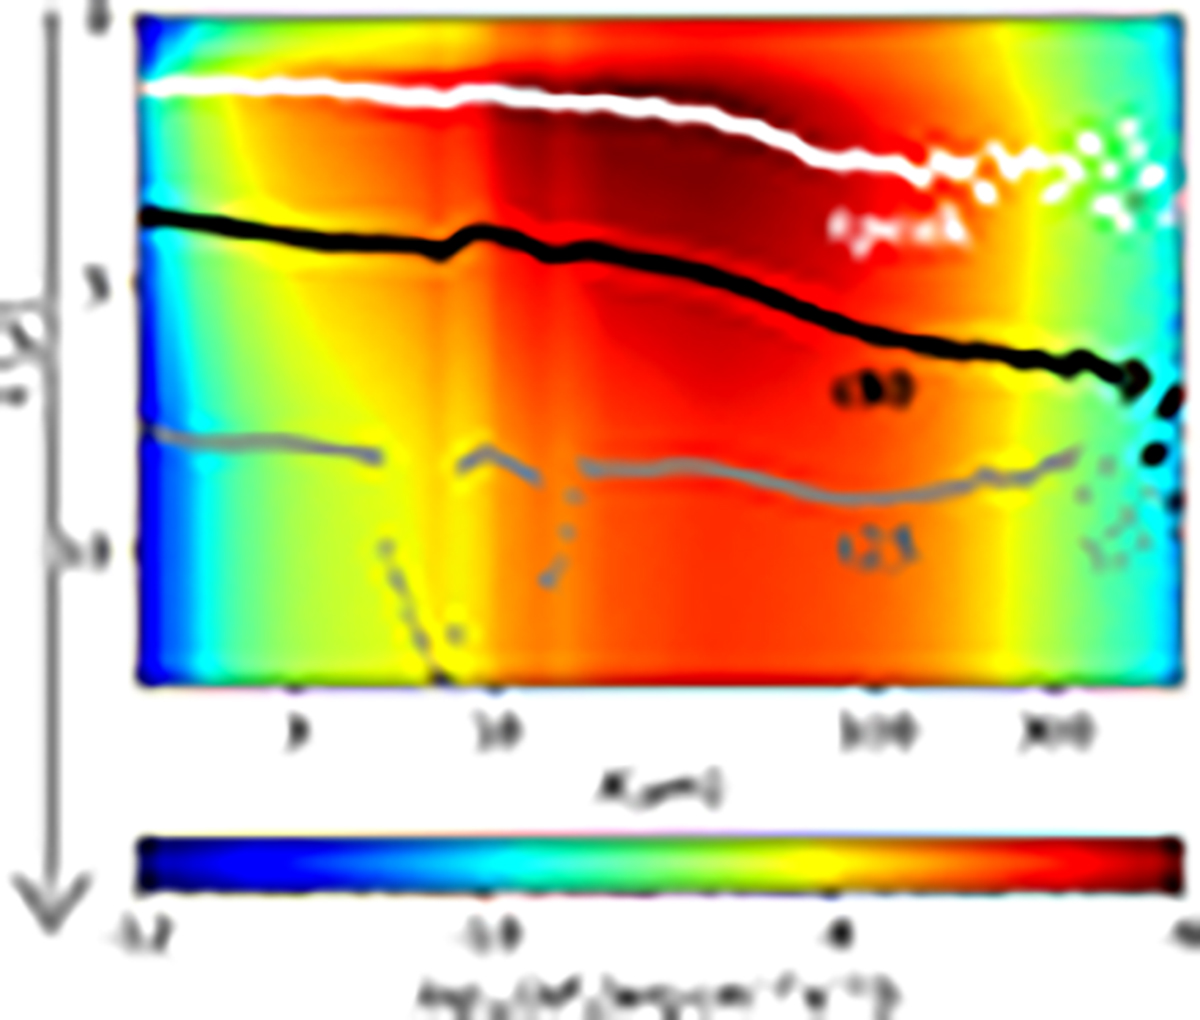
Dynamic SED showing the flux density over wavelength and time (increasing from top to bottom) of the mean-setting and a burst with an energy of 2.3 × 1047 erg. Time 0 marks the onset of the burst. Horizontal lines indicate the peak time (white triangles), the time when 80% of the energy is released in the respective band (black dots), and when the flux increase is back at 1.25 times the pre-burst level (gray crosses). The increase in scatter in the (sub)mm range is due to lower synthetic photon counts.
Current usage metrics show cumulative count of Article Views (full-text article views including HTML views, PDF and ePub downloads, according to the available data) and Abstracts Views on Vision4Press platform.
Data correspond to usage on the plateform after 2015. The current usage metrics is available 48-96 hours after online publication and is updated daily on week days.
Initial download of the metrics may take a while.