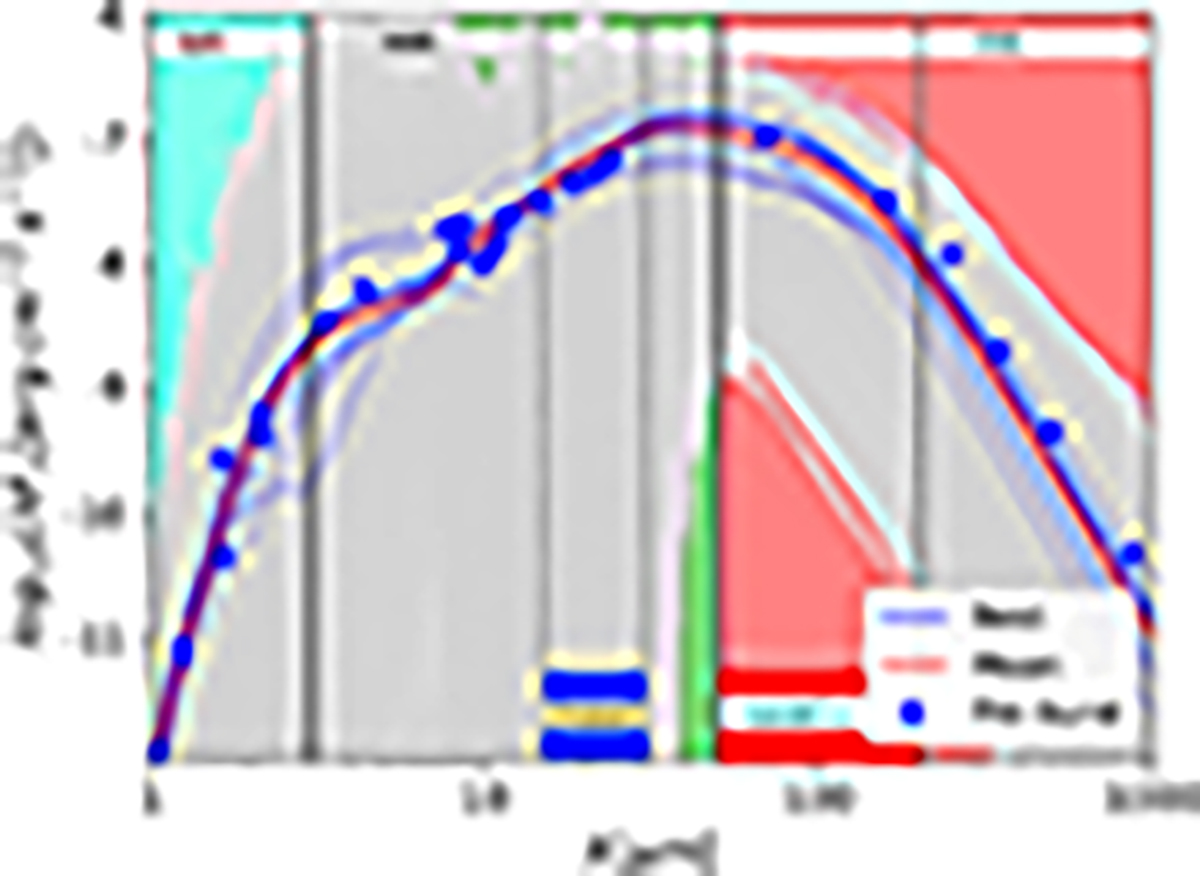
Fig. 15.
Download original image
All TORUS models (gray), together with the pre-burst SED (blue dots), the ten best fits (blue, the best one is darkest), and the mean model (red). The model SEDs are reddened according to the foreground extinction of 18 mag (Murphy et al. 2010). Background colors indicate different wavelength ranges. The SED peaks in the MIR/FIR. The wavelength range of HAWC+ is indicated at the bottom. That for radiative maser excitation (Ostrovskii & Sobolev 2002) is highlighted in blue. Flux densities are listed in Table A.3. The mean model fits the pre-burst SED quite well.
Current usage metrics show cumulative count of Article Views (full-text article views including HTML views, PDF and ePub downloads, according to the available data) and Abstracts Views on Vision4Press platform.
Data correspond to usage on the plateform after 2015. The current usage metrics is available 48-96 hours after online publication and is updated daily on week days.
Initial download of the metrics may take a while.