Fig. 14.
Download original image
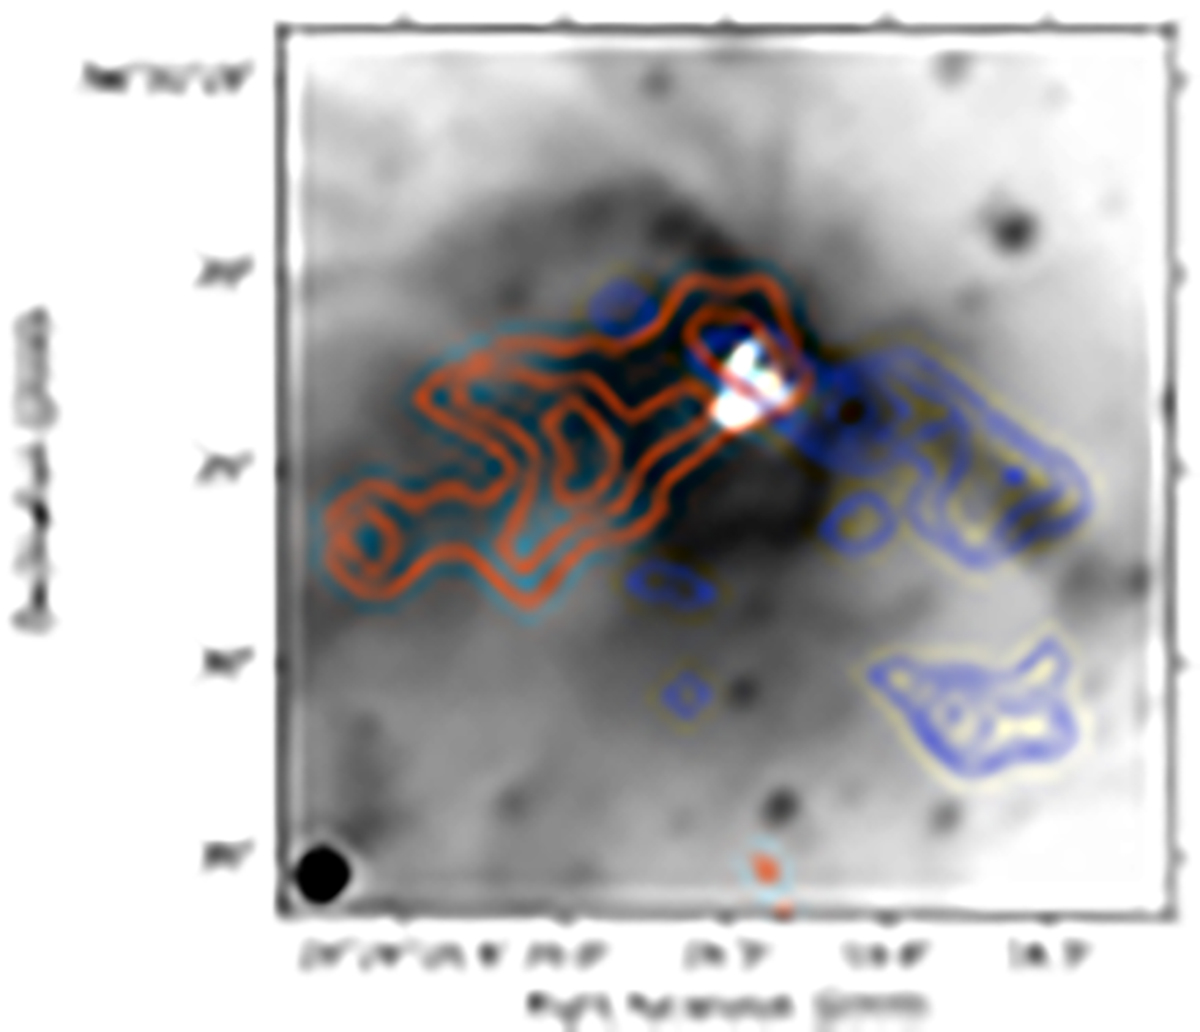
Distribution of the redshifted and blueshifted 13CO (2–1) line emission as mapped with the ALMA 12-m Array superimposed on a Ks image taken in mid-2015. The synthesized ALMA beam size for the line observations is shown in the lower left. The compact 1.4 mm emission, mapped at much higher resolution, appears as a small blob within the white saturated pixels.
Current usage metrics show cumulative count of Article Views (full-text article views including HTML views, PDF and ePub downloads, according to the available data) and Abstracts Views on Vision4Press platform.
Data correspond to usage on the plateform after 2015. The current usage metrics is available 48-96 hours after online publication and is updated daily on week days.
Initial download of the metrics may take a while.