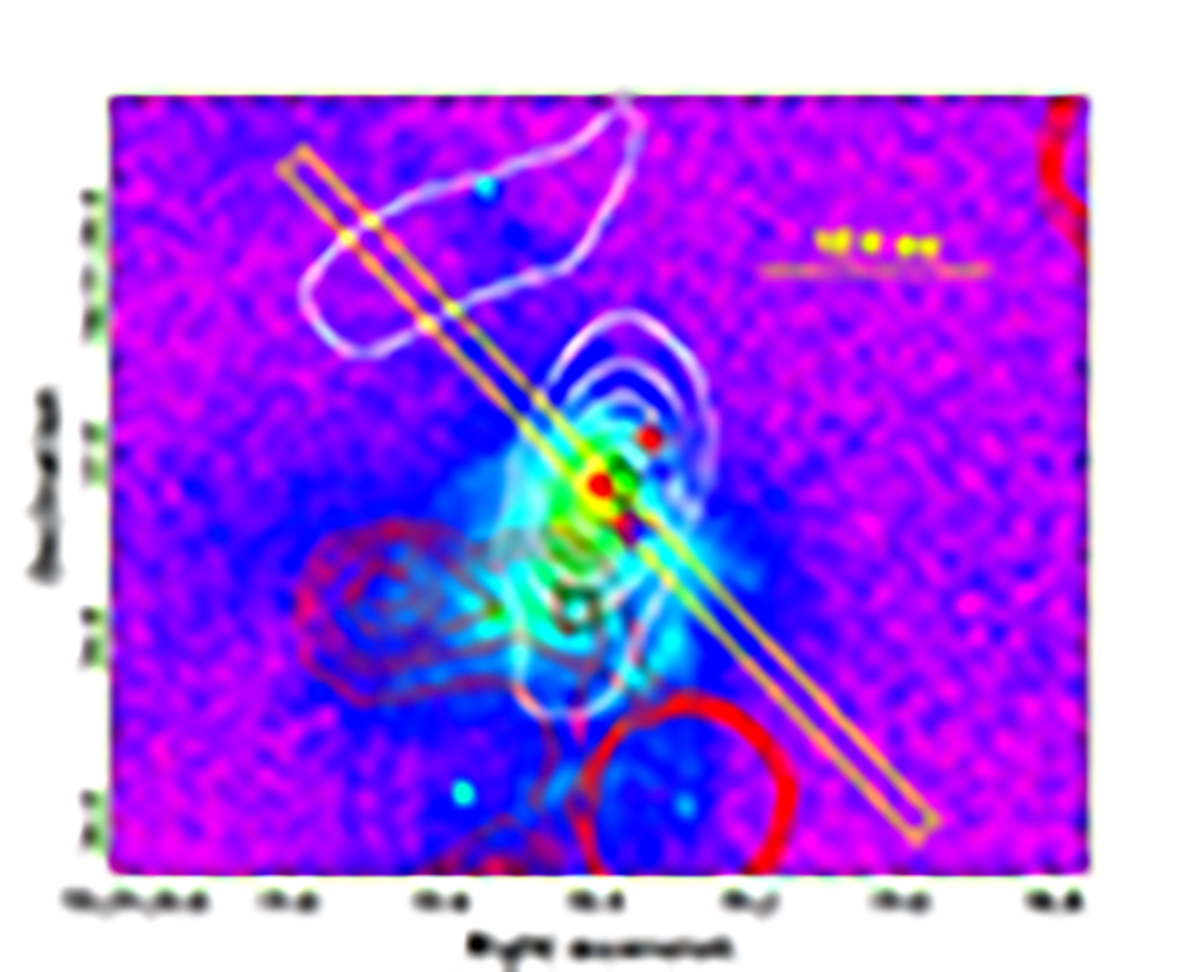
Fig. 10.
Download original image
NACO AO Ks-band image (epoch 2009) using a logarithmic stretch with contours of the 19 GHz radio continuum (white, Murphy et al. 2010) and from the Z-band pre-burst image (red, epoch 2010). Maser spots are marked by crosses in blue (Caswell & Reynolds 2001, epoch 1994) and red (Green et al. 2015, epoch 2011), with sizes indicating the position error. The black diamond is at the peak of the 1.4 mm emission while the black square marks the Gaia source. The yellow rectangle shows orientation and width of the ISAAC slit.
Current usage metrics show cumulative count of Article Views (full-text article views including HTML views, PDF and ePub downloads, according to the available data) and Abstracts Views on Vision4Press platform.
Data correspond to usage on the plateform after 2015. The current usage metrics is available 48-96 hours after online publication and is updated daily on week days.
Initial download of the metrics may take a while.