Fig. 9
Download original image
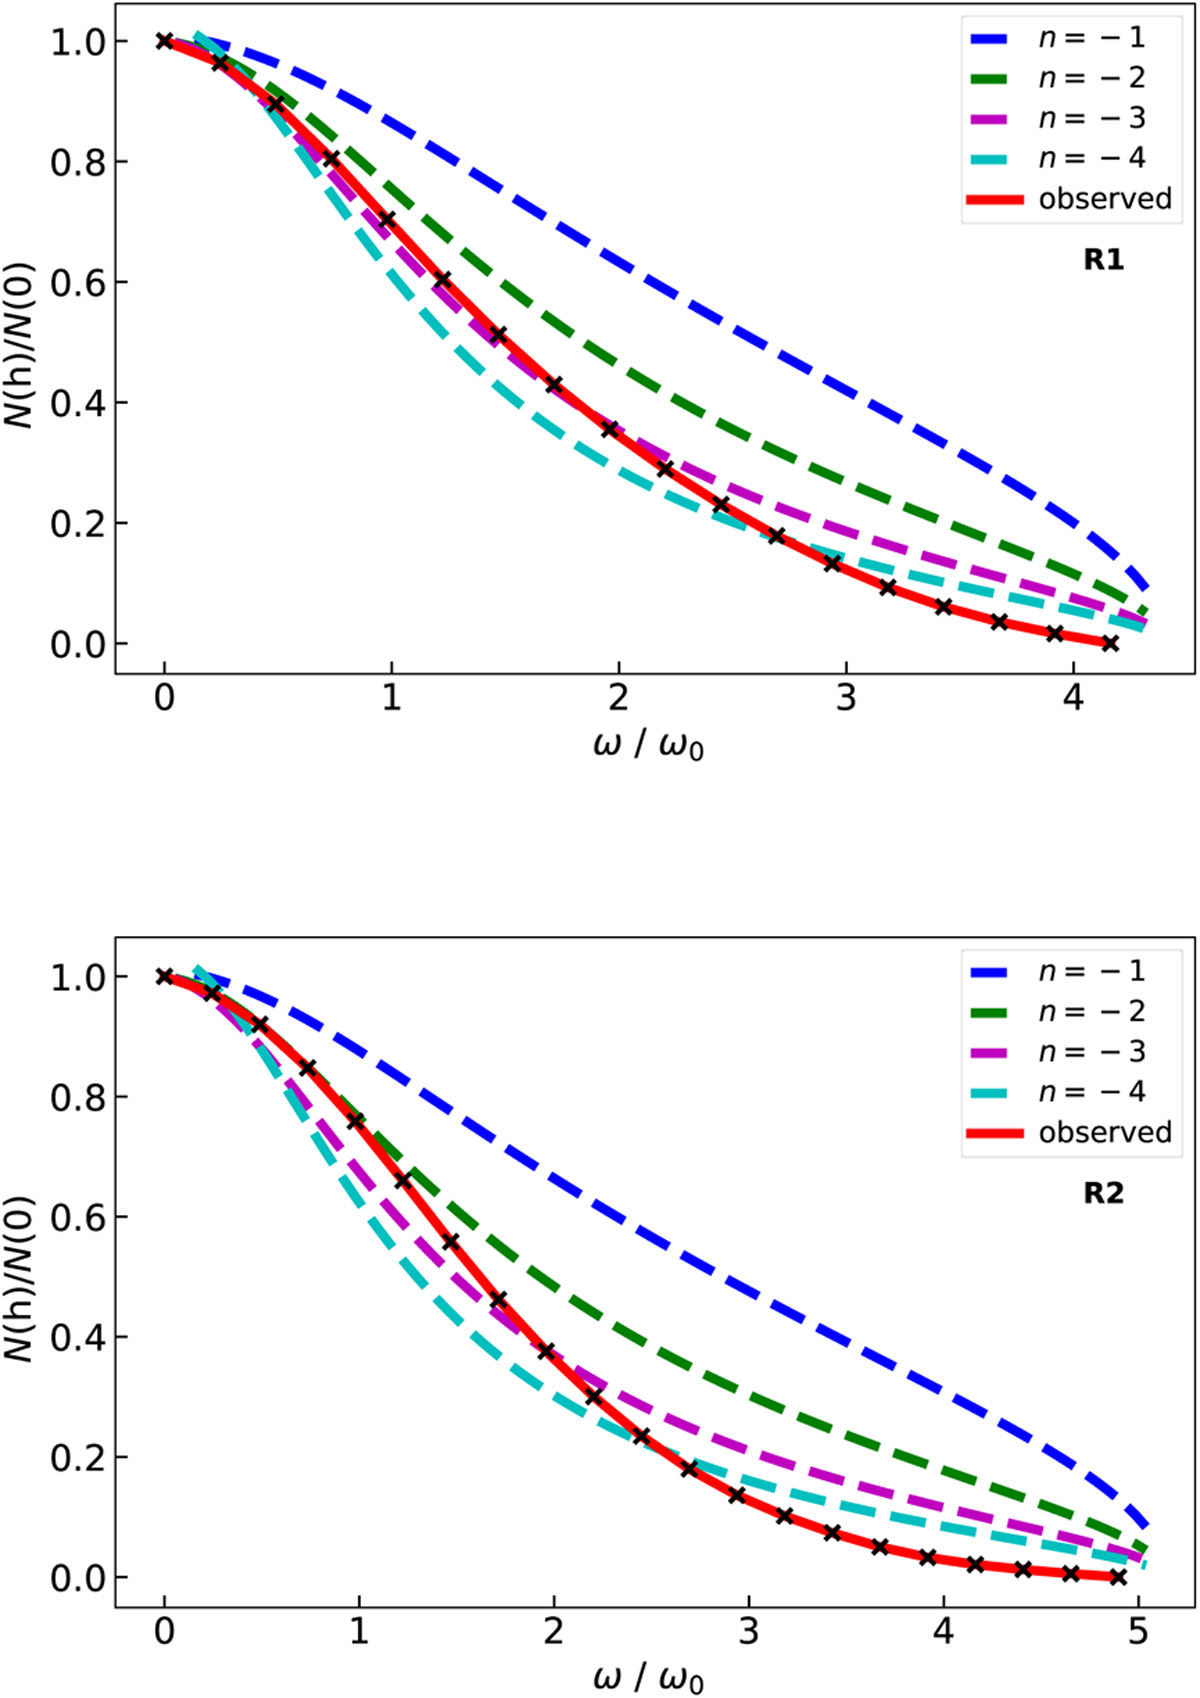
Radial column density profiles (with background subtraction and normalized to the central column density, N(0)) of both observations (solid red curves) and polytropic cylinder models with n = −1, −2, −3, −4 (dashed curves). The radius is normalized to ϖ0. The black crosses indicate the observation data points. The top and bottom panels describe regions R1 and R2 of the filament, respectively.
Current usage metrics show cumulative count of Article Views (full-text article views including HTML views, PDF and ePub downloads, according to the available data) and Abstracts Views on Vision4Press platform.
Data correspond to usage on the plateform after 2015. The current usage metrics is available 48-96 hours after online publication and is updated daily on week days.
Initial download of the metrics may take a while.