Fig. 7
Download original image
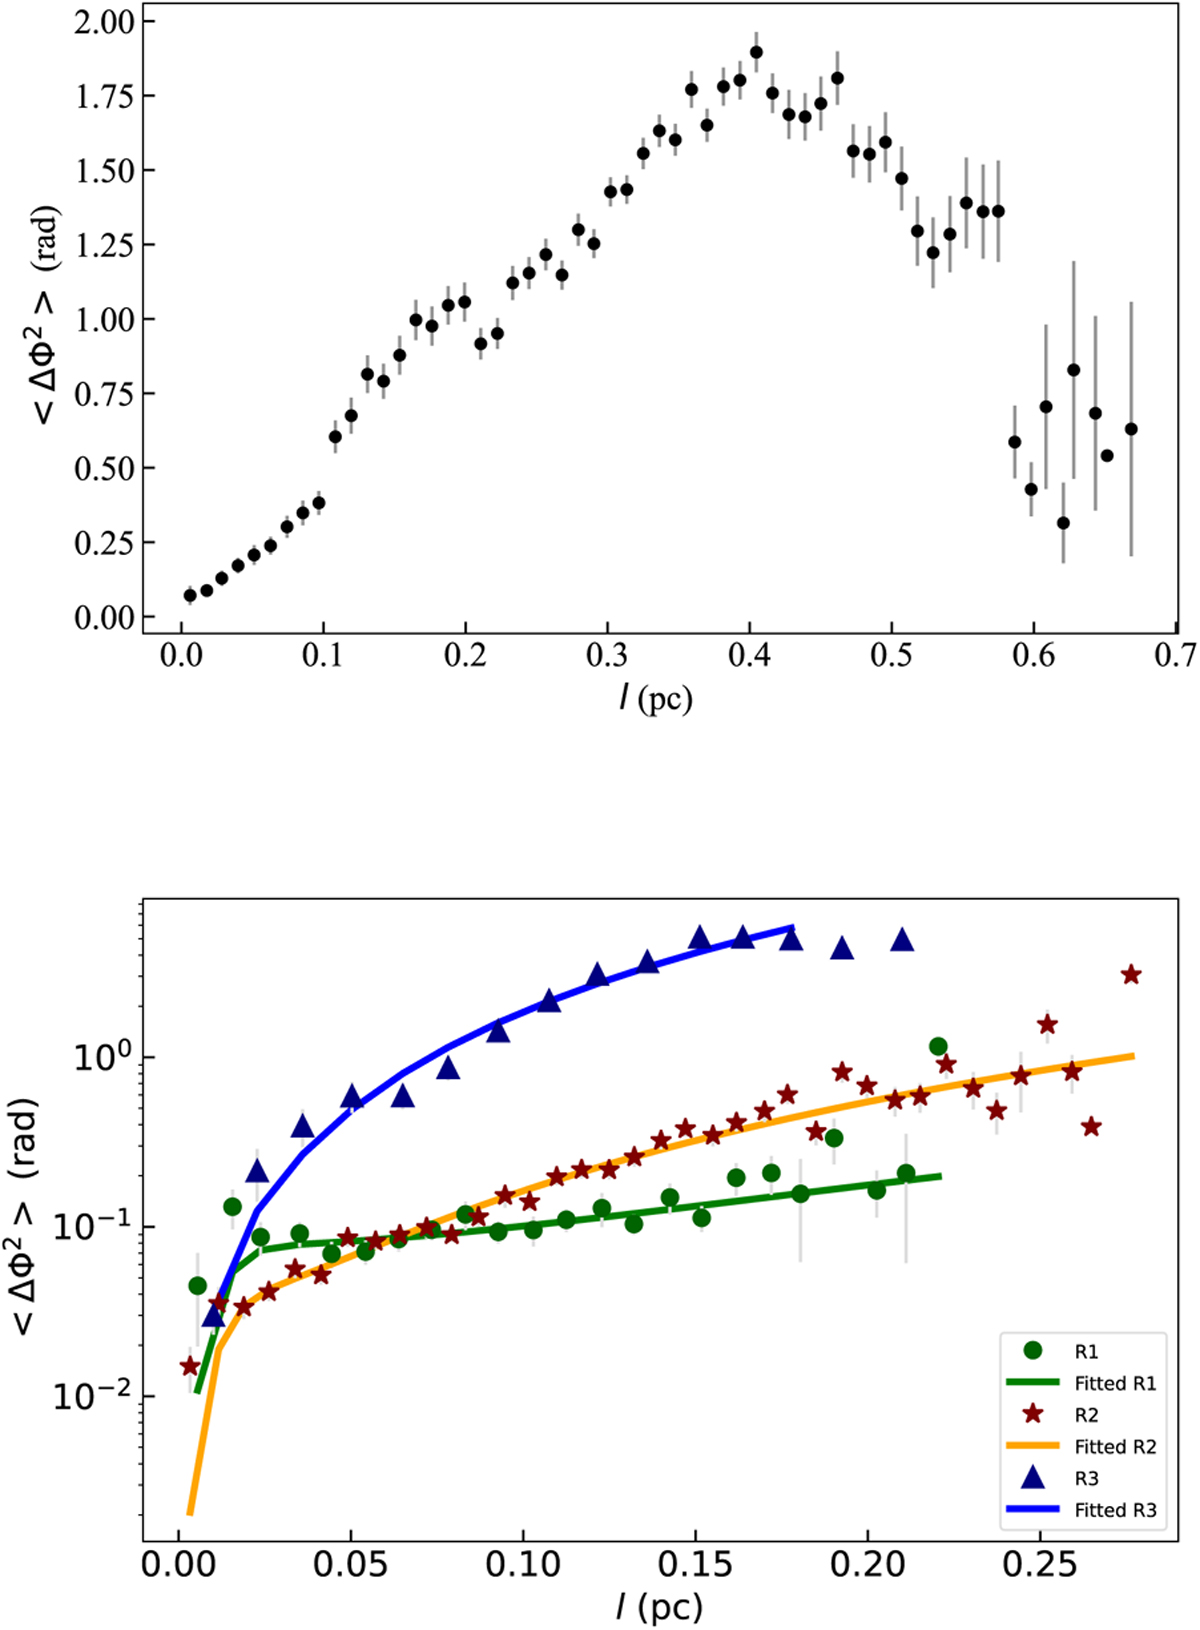
ADF versus distance, l. Top panel: ADF for the whole filament. Bottom panel: same but for the three filament regions. The best fits to the data points using Eq. (9) for R1, R2, and R3 are shown with the green, orange, and blue curves, respectively. Measurement uncertainties are displayed as error bars, which are not visible for small values of l due to the higher statistics.
Current usage metrics show cumulative count of Article Views (full-text article views including HTML views, PDF and ePub downloads, according to the available data) and Abstracts Views on Vision4Press platform.
Data correspond to usage on the plateform after 2015. The current usage metrics is available 48-96 hours after online publication and is updated daily on week days.
Initial download of the metrics may take a while.