Fig. 5
Download original image
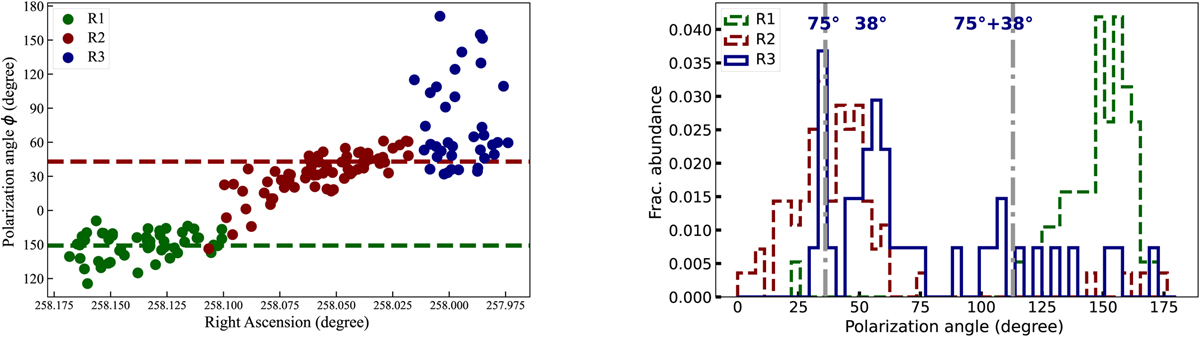
Distribution of polarization angles. Left panel: distribution of polarization angles as a function of the right ascension of the field. Dashed green and red lines show the mean polarization angle values for R1 and R2, 147°, and 43°, respectively. Right panel: histogram of the distribution of magnetic polarization angles. Green, red, and blue data points refer to R1, R2, and R3, respectively. Gray dash-dot lines illustrate the 1σ interval around the mean for region R3.
Current usage metrics show cumulative count of Article Views (full-text article views including HTML views, PDF and ePub downloads, according to the available data) and Abstracts Views on Vision4Press platform.
Data correspond to usage on the plateform after 2015. The current usage metrics is available 48-96 hours after online publication and is updated daily on week days.
Initial download of the metrics may take a while.