Fig. 4
Download original image
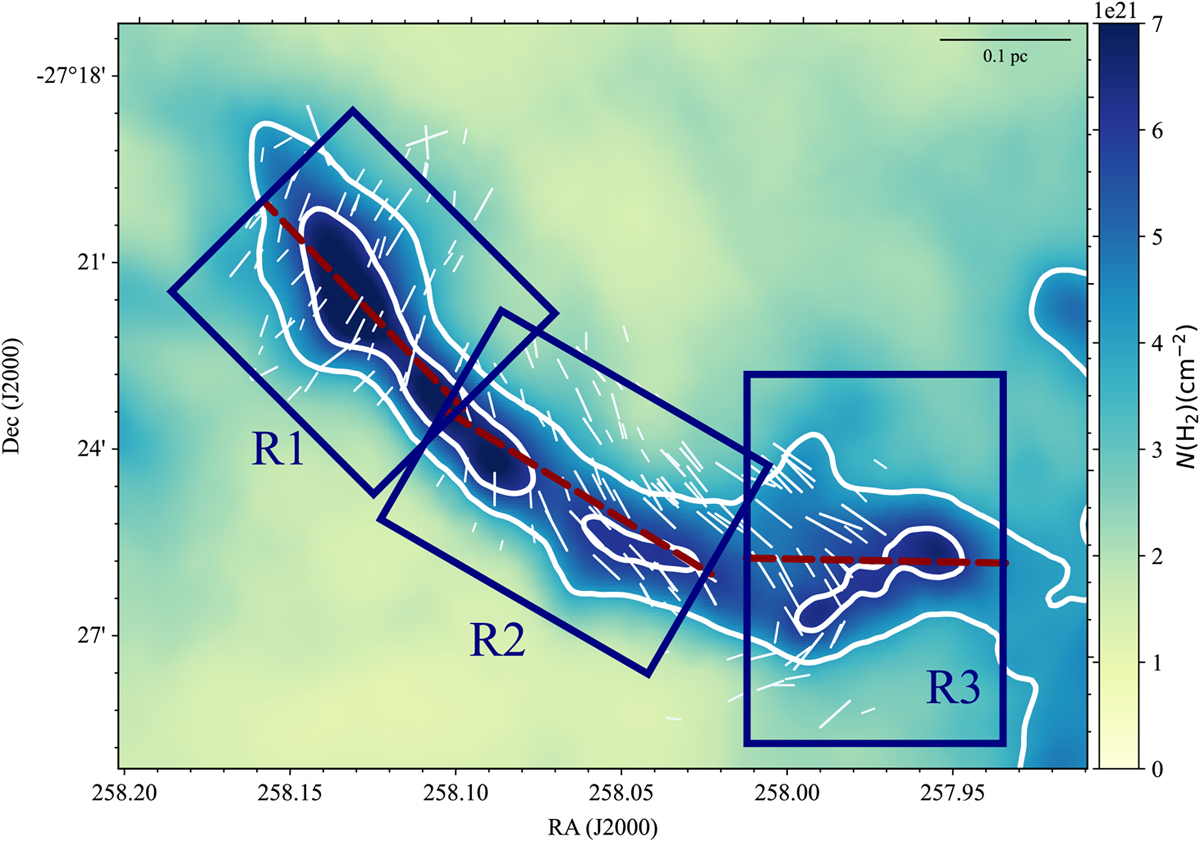
The column density map of the filament in B59 (from Herschel data) overlaid with the polarization segments from Pico dos Dias Observatory. The blue rectangles divide the filament into three regions labeled R1, R2, and R3. The red dashed lines represent the axis of each region. Contours show column density of H2 with levels: [4, 6] × 1022 cm2. The scale bar is on the top right side of the panel.
Current usage metrics show cumulative count of Article Views (full-text article views including HTML views, PDF and ePub downloads, according to the available data) and Abstracts Views on Vision4Press platform.
Data correspond to usage on the plateform after 2015. The current usage metrics is available 48-96 hours after online publication and is updated daily on week days.
Initial download of the metrics may take a while.