Fig. 2
Download original image
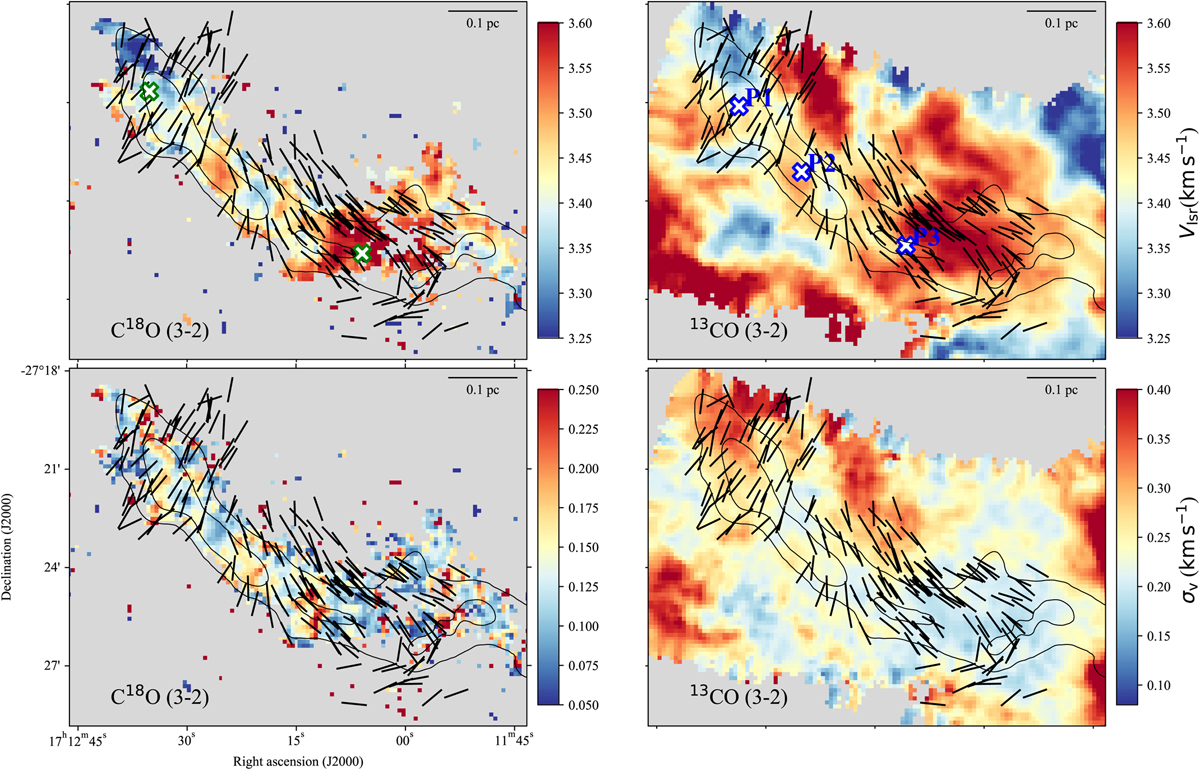
Maps of kinematic parameters. Top panels: centroid velocity maps of 13CO (3–2) and C18O (3–2) obtained from the Gaussian fitting procedure described in Sect. 3. Bottom panels: velocity dispersion maps of 13CO and C18O. Contours show the column density of H2 with levels [4, 6] ×1022 cm−2, as derived from Herschel data (Peretto et al. 2012). The black segments represent the polarization angles in the NIR band. The blue crosses in the top-right panel present the locations of spectra in Fig. 3. The green crosses represent the locations where the velocity gradient is estimated. Scale bars are at the top right of each panel.
Current usage metrics show cumulative count of Article Views (full-text article views including HTML views, PDF and ePub downloads, according to the available data) and Abstracts Views on Vision4Press platform.
Data correspond to usage on the plateform after 2015. The current usage metrics is available 48-96 hours after online publication and is updated daily on week days.
Initial download of the metrics may take a while.