Open Access
Fig. A.1
Download original image
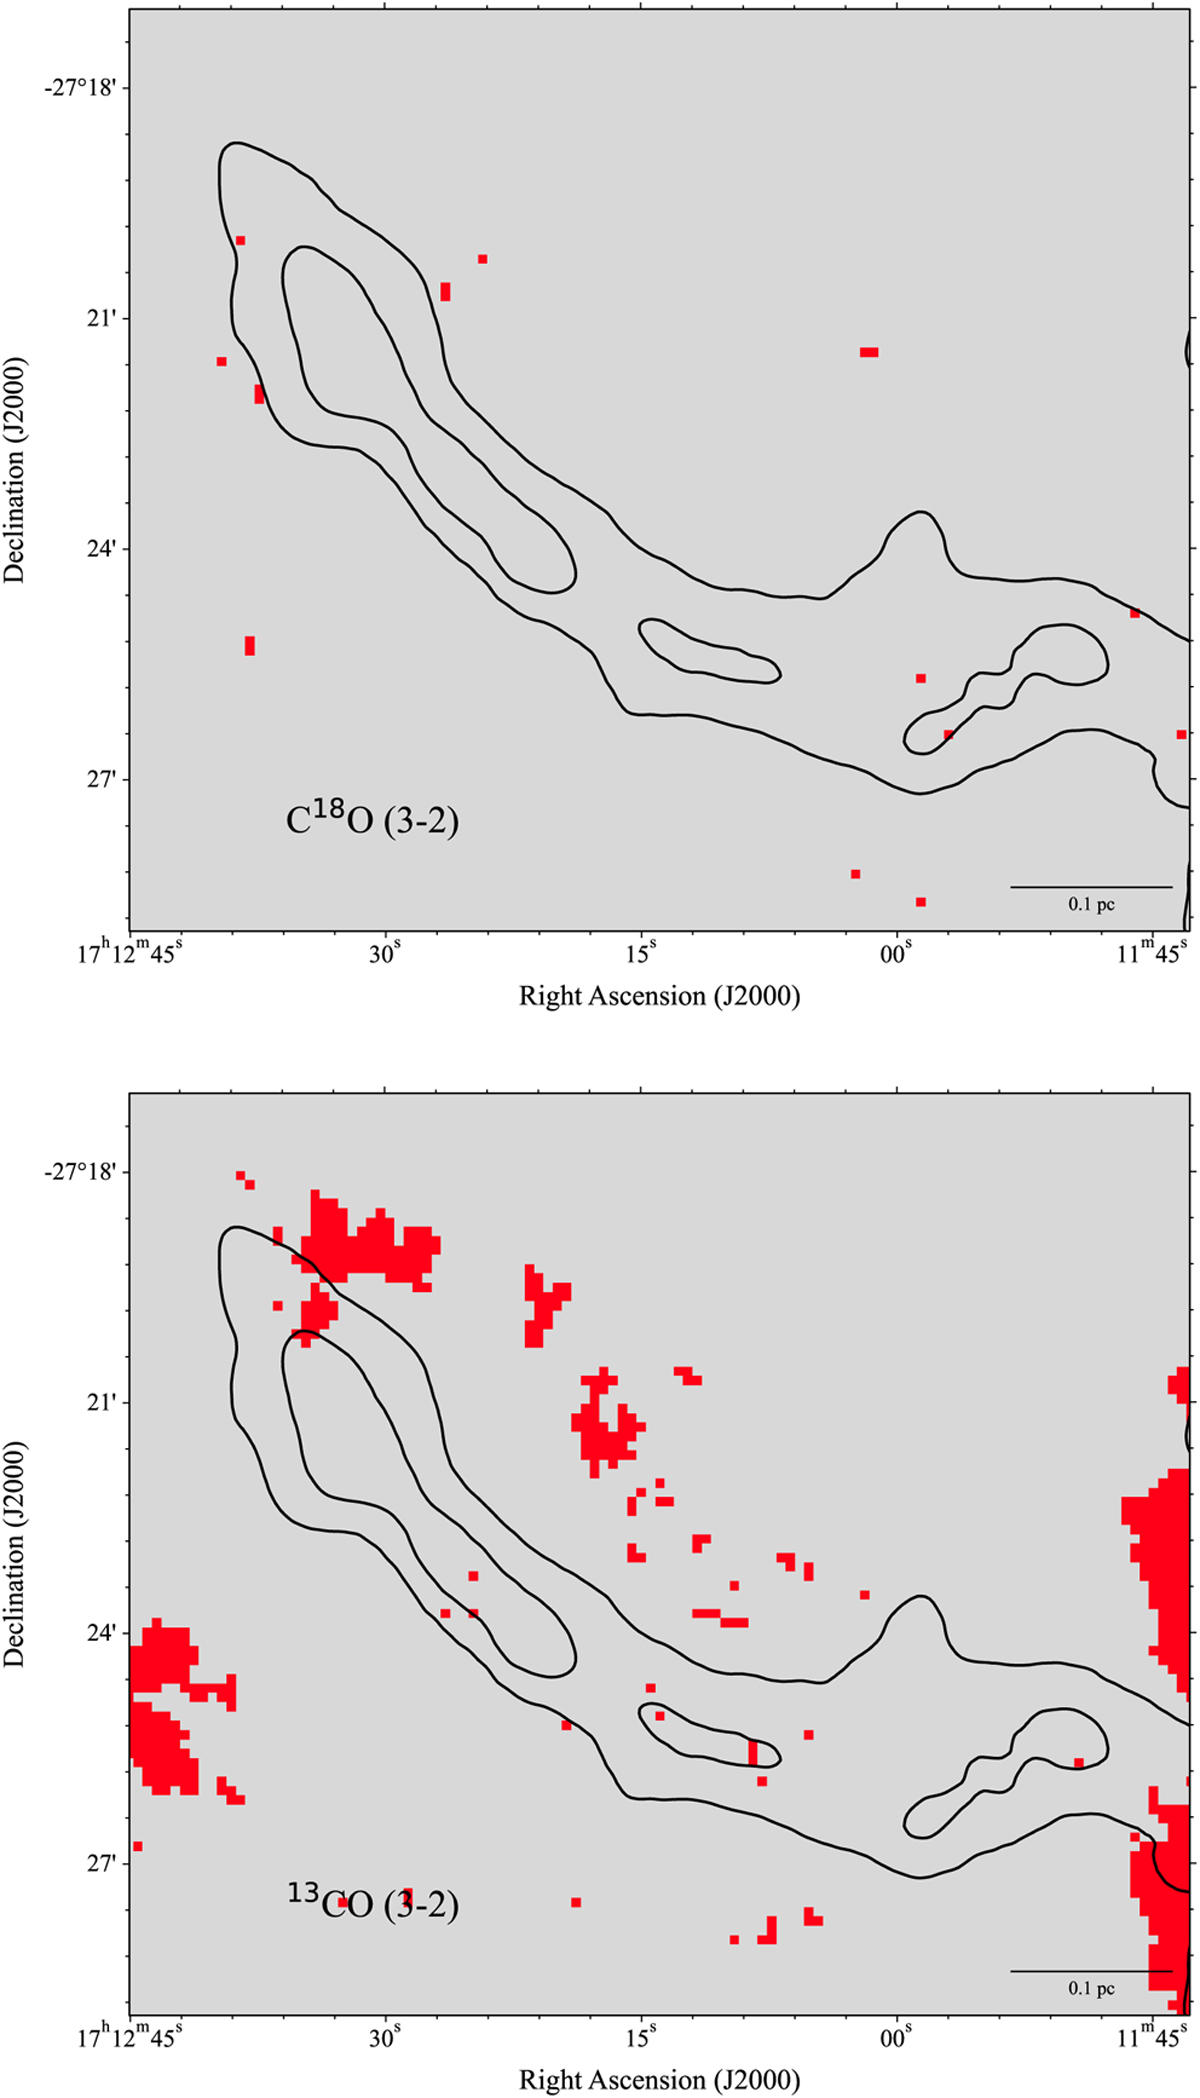
Positions where the Gaussian fit fails for C18O (3–2) and 13CO (3–2), shown in the top and bottom panels, respectively. Contours shows the column density of H2 with levels [4,6] ×1022 cm2. Scale bars are at the bottom right of each panel.
Current usage metrics show cumulative count of Article Views (full-text article views including HTML views, PDF and ePub downloads, according to the available data) and Abstracts Views on Vision4Press platform.
Data correspond to usage on the plateform after 2015. The current usage metrics is available 48-96 hours after online publication and is updated daily on week days.
Initial download of the metrics may take a while.