Fig. 1
Download original image
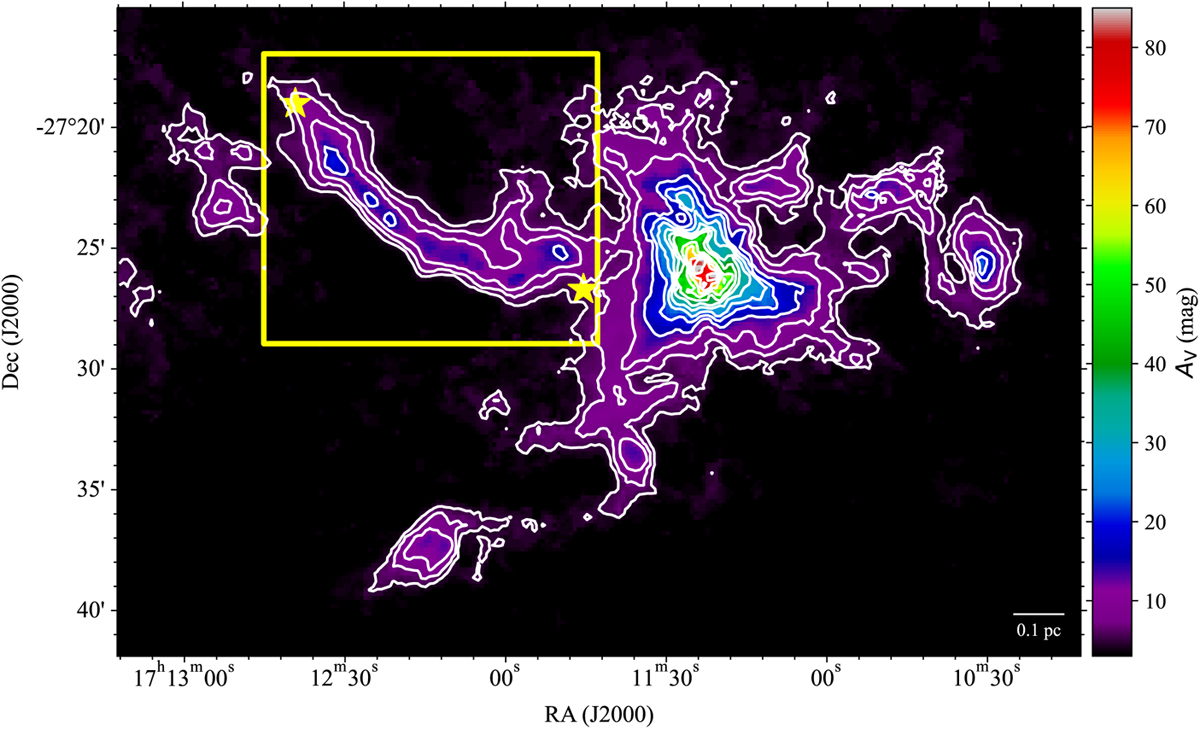
Dust extinction map of the B59 region at a spatial resolution of 20″ (Román-Zúñiga et al. 2010). The solid white line contours represent levels of visual extinction at AV = [5, 7, 10, 15, 20, 25, 30, 35, 40, 50, 60, 70, 80, 90] mag. The yellow square marks the filament studied in this work. Two yellow stars indicate the approximate length of the filament. The scale bar is at the bottom right side of the panel.
Current usage metrics show cumulative count of Article Views (full-text article views including HTML views, PDF and ePub downloads, according to the available data) and Abstracts Views on Vision4Press platform.
Data correspond to usage on the plateform after 2015. The current usage metrics is available 48-96 hours after online publication and is updated daily on week days.
Initial download of the metrics may take a while.