Fig. 8
Download original image
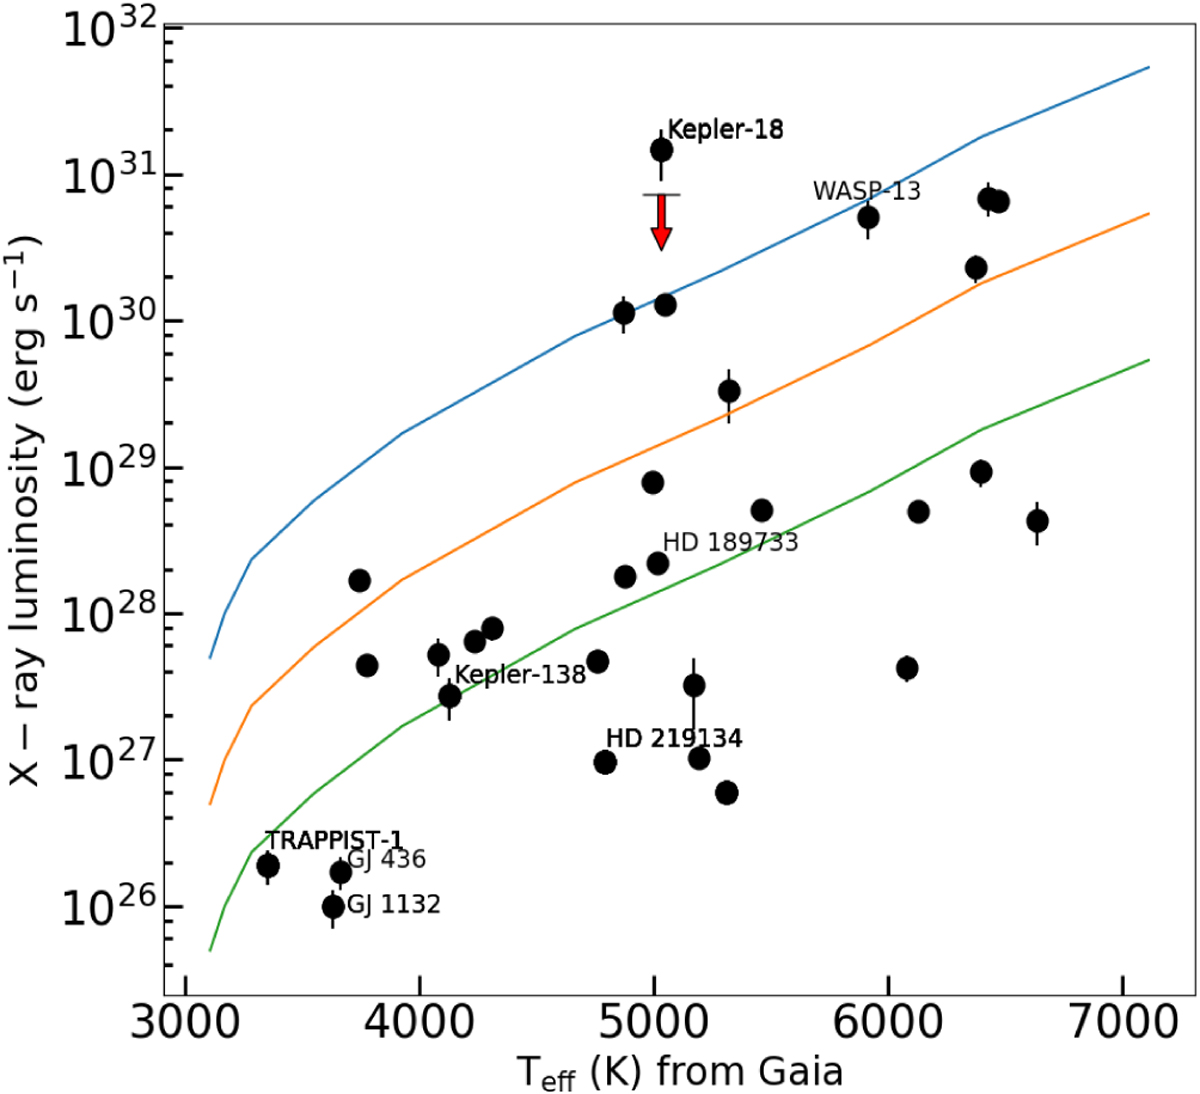
Distribution of the detected X-ray luminosity as a function of the stellar effective temperature. The blue line shows the log LX/Lbol = −3 saturation limit. The orange line is −4 and green is −5. The Kepler-18 data point is an Einstein 1ks exposure-time detection from 1979. Later XMM-slew surveys with much lower exposure times found an upper limit indicated by the red arrow.
Current usage metrics show cumulative count of Article Views (full-text article views including HTML views, PDF and ePub downloads, according to the available data) and Abstracts Views on Vision4Press platform.
Data correspond to usage on the plateform after 2015. The current usage metrics is available 48-96 hours after online publication and is updated daily on week days.
Initial download of the metrics may take a while.