Open Access
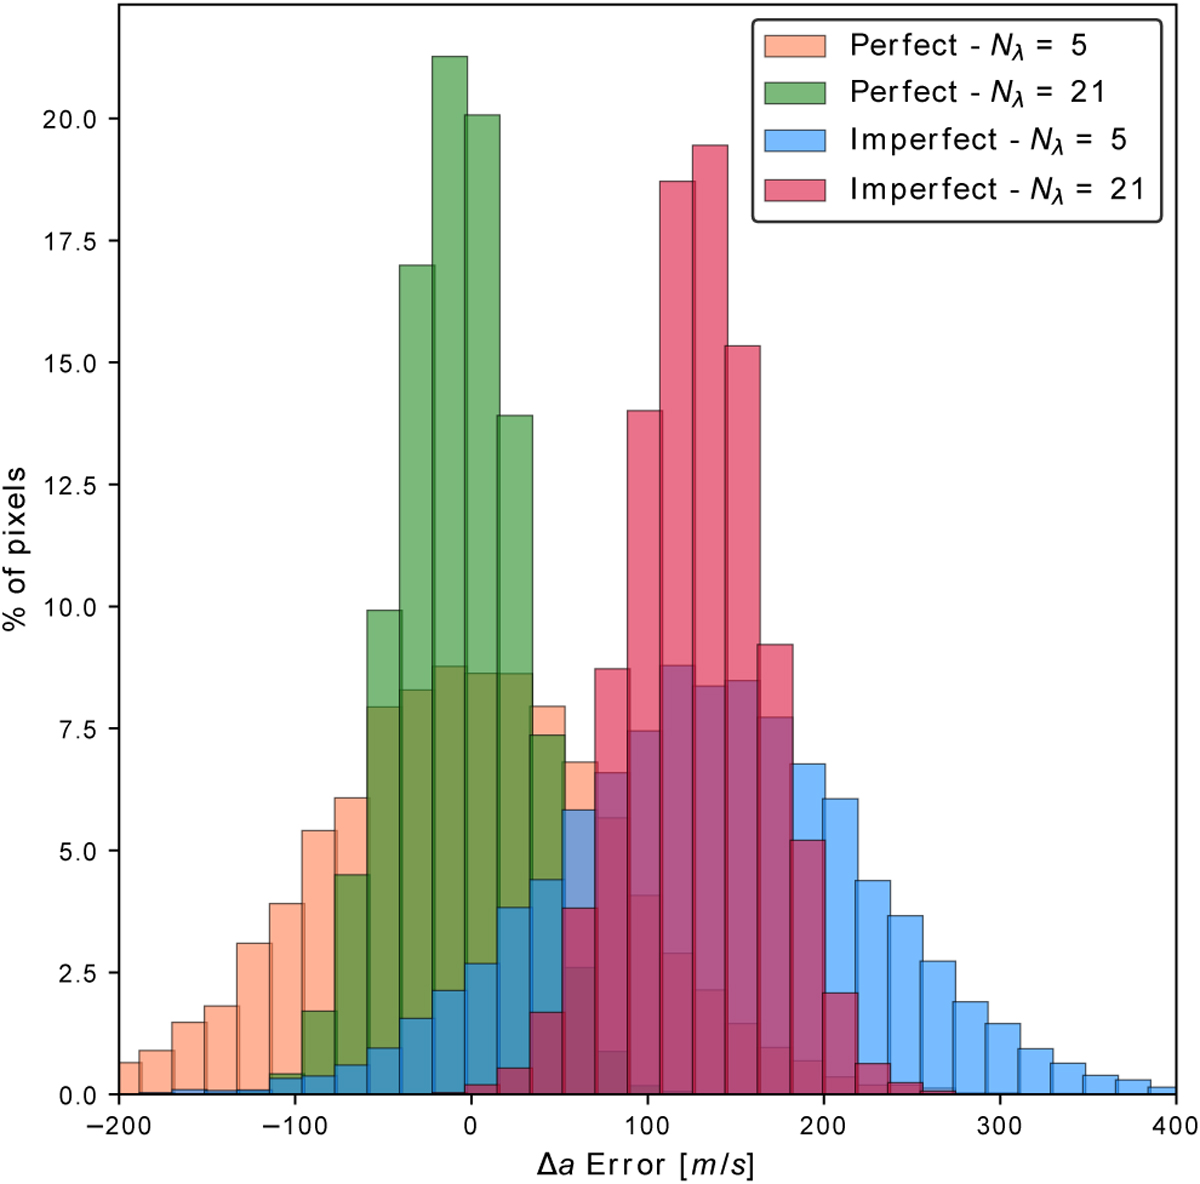
Fig. 9
Download original image
Distribution of the errors in the determination of ∆a for the crossover scenarios (different configuration in the observation generation and minimization algorithm) for both perfect and imperfect configurations. Only results for the two extreme spectral samplings (Nλ = 5 and Nλ = 21) are shown.
Current usage metrics show cumulative count of Article Views (full-text article views including HTML views, PDF and ePub downloads, according to the available data) and Abstracts Views on Vision4Press platform.
Data correspond to usage on the plateform after 2015. The current usage metrics is available 48-96 hours after online publication and is updated daily on week days.
Initial download of the metrics may take a while.