Open Access
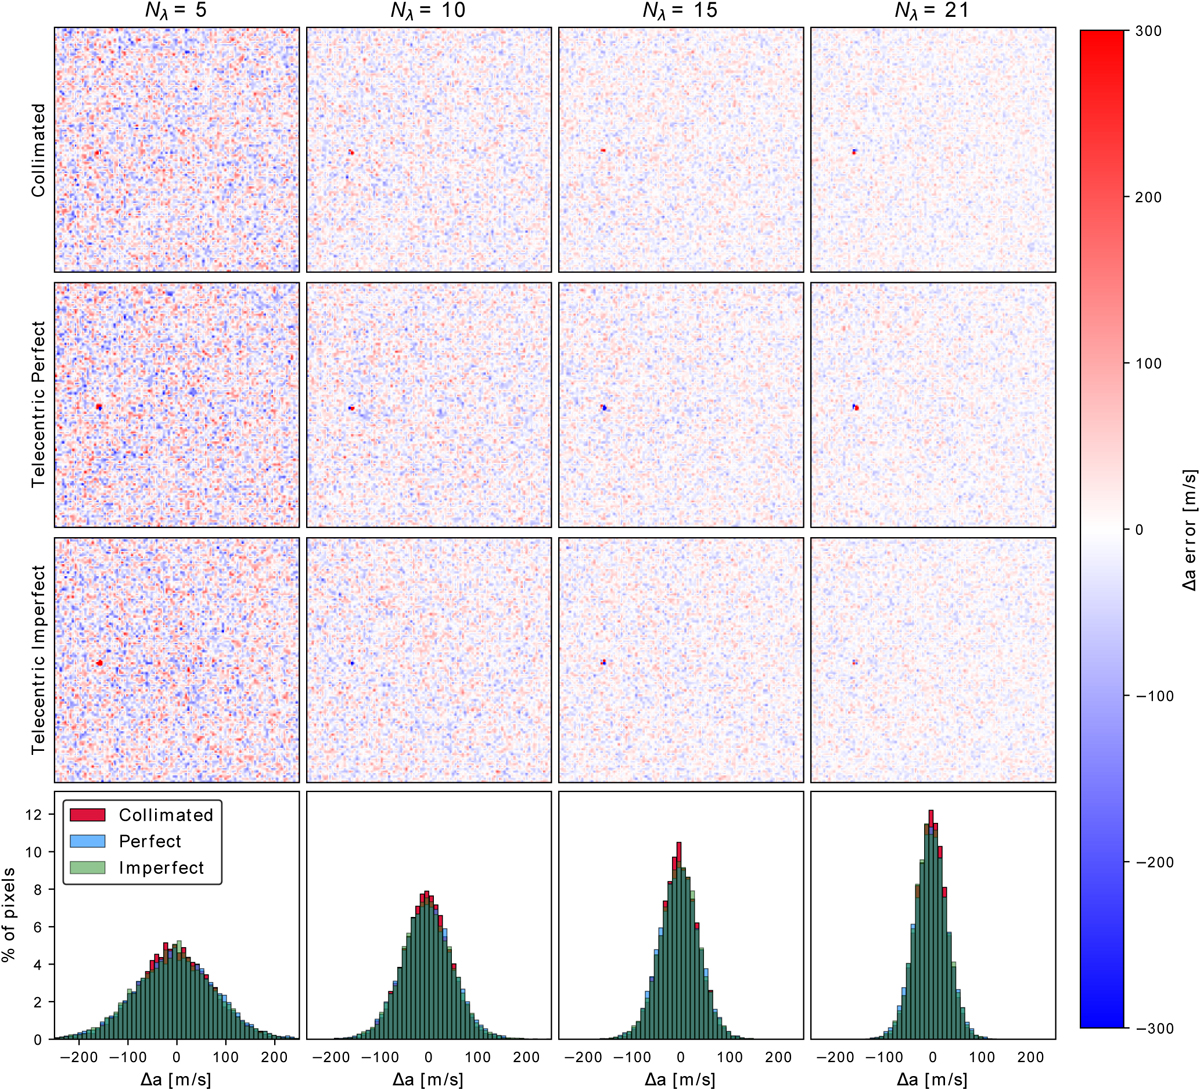
Fig. 7
Download original image
Distribution of the errors in the ∆a computation for the three configurations (first three rows) and different spectral samplings (columns). In the bottom panels of each column, the error distribution for the corresponding spectral sampling is shown for the three configurations.
Current usage metrics show cumulative count of Article Views (full-text article views including HTML views, PDF and ePub downloads, according to the available data) and Abstracts Views on Vision4Press platform.
Data correspond to usage on the plateform after 2015. The current usage metrics is available 48-96 hours after online publication and is updated daily on week days.
Initial download of the metrics may take a while.