Fig. 3
Download original image
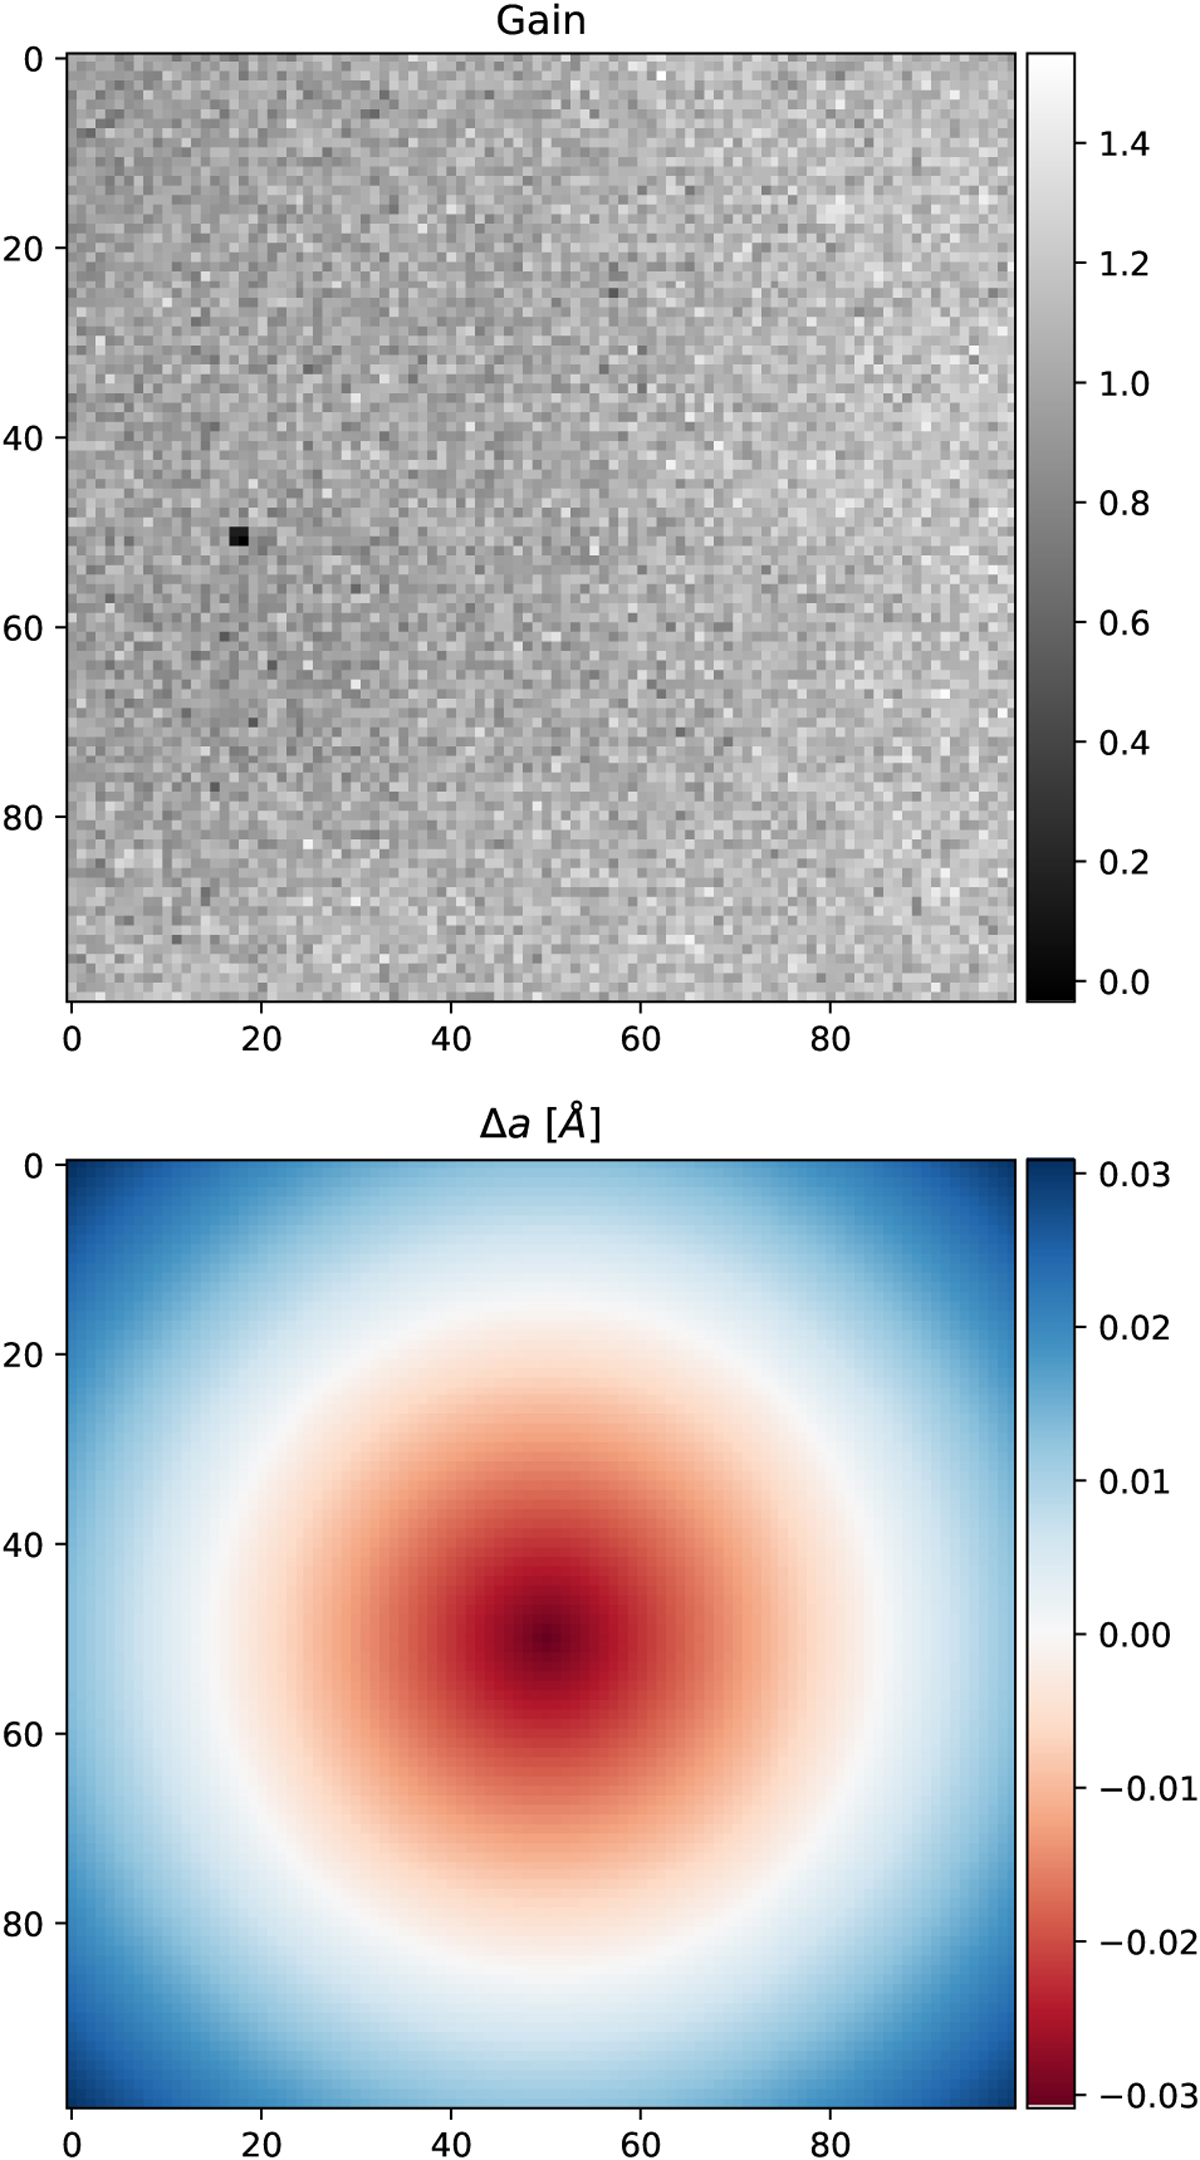
Input maps introduced when simulating the observations. The top panel represents the gain generated as white Gaussian noise, with values ranging from 0.8 to 1.2. A dust speck was introduced by creating a group of four pixels with low values of 𝑔 = 0.2 for the gain. The bottom panel shows the spatial distribution of the defects in the etalon. The distribution follows a radial pattern starting from the center of the FoV. The defects vary from 0% deviation to up to 5 × 10⁻⁴%, which corresponds to a shift of 3 pm. Both possible directions for the deviations have been considered. The sign of the deviation is negative at the very center, which introduces a redshift, while it is positive at the corners, causing a shift of the profile into the blue.
Current usage metrics show cumulative count of Article Views (full-text article views including HTML views, PDF and ePub downloads, according to the available data) and Abstracts Views on Vision4Press platform.
Data correspond to usage on the plateform after 2015. The current usage metrics is available 48-96 hours after online publication and is updated daily on week days.
Initial download of the metrics may take a while.