Fig. 2
Download original image
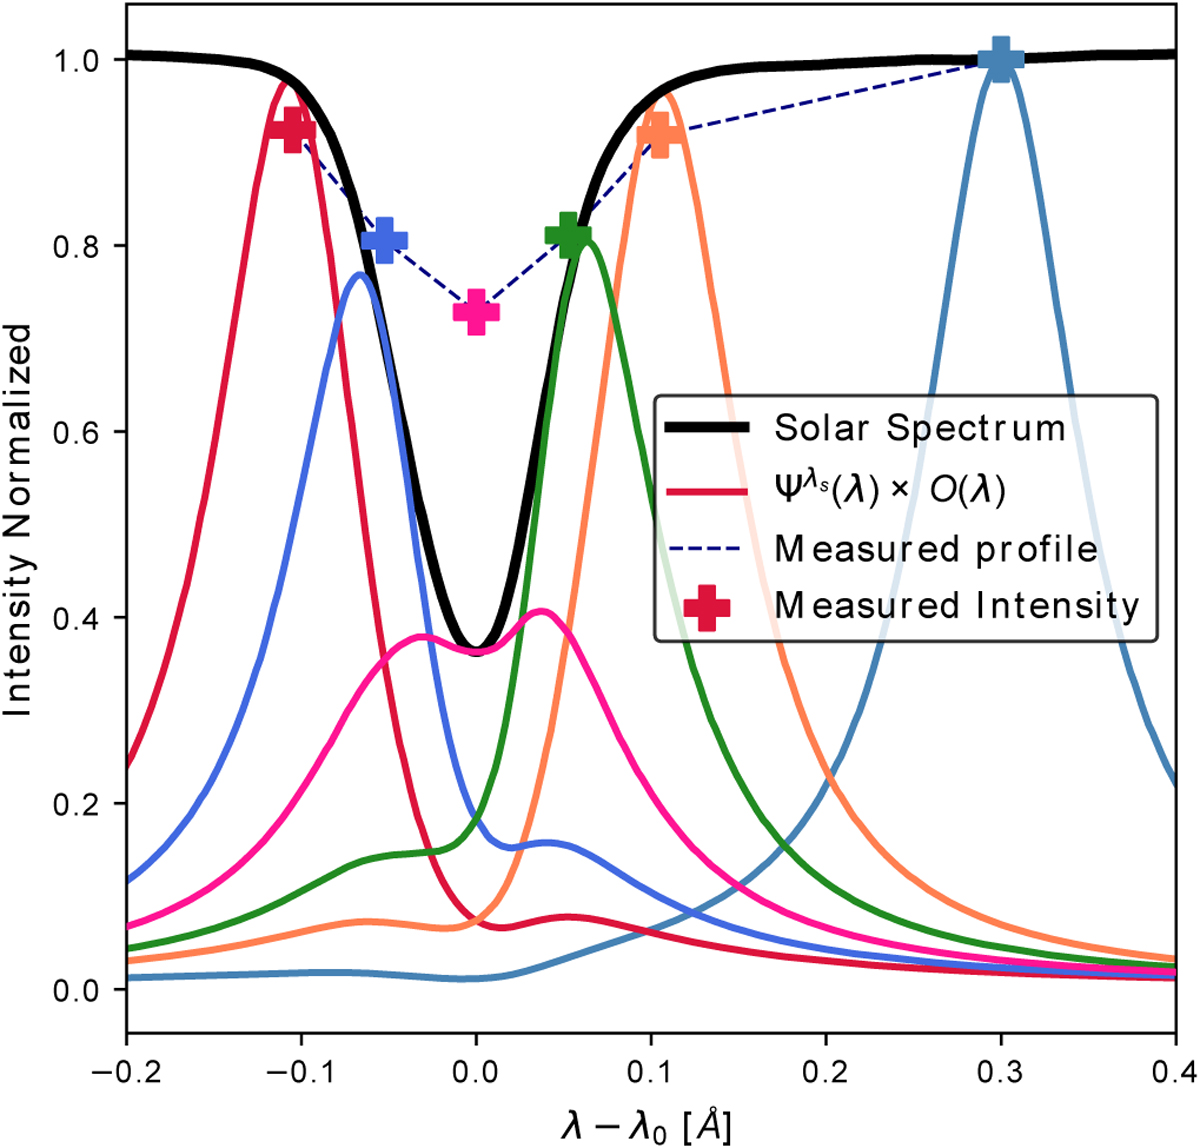
Simulated observation of the Fe I spectral line (λ0 = 6173.3 Å) using a collimated mount and a total of Nλ = 6 wavelengths that have been equally distributed along the spectral line, with the exception of the continuum measurement (light blue), which is selected at 300 mÅ from the blue of the line core. The measured intensity is the result of computing the value given by Eq. (10) at each wavelength and with 𝑔=1.
Current usage metrics show cumulative count of Article Views (full-text article views including HTML views, PDF and ePub downloads, according to the available data) and Abstracts Views on Vision4Press platform.
Data correspond to usage on the plateform after 2015. The current usage metrics is available 48-96 hours after online publication and is updated daily on week days.
Initial download of the metrics may take a while.