Fig. 11
Download original image
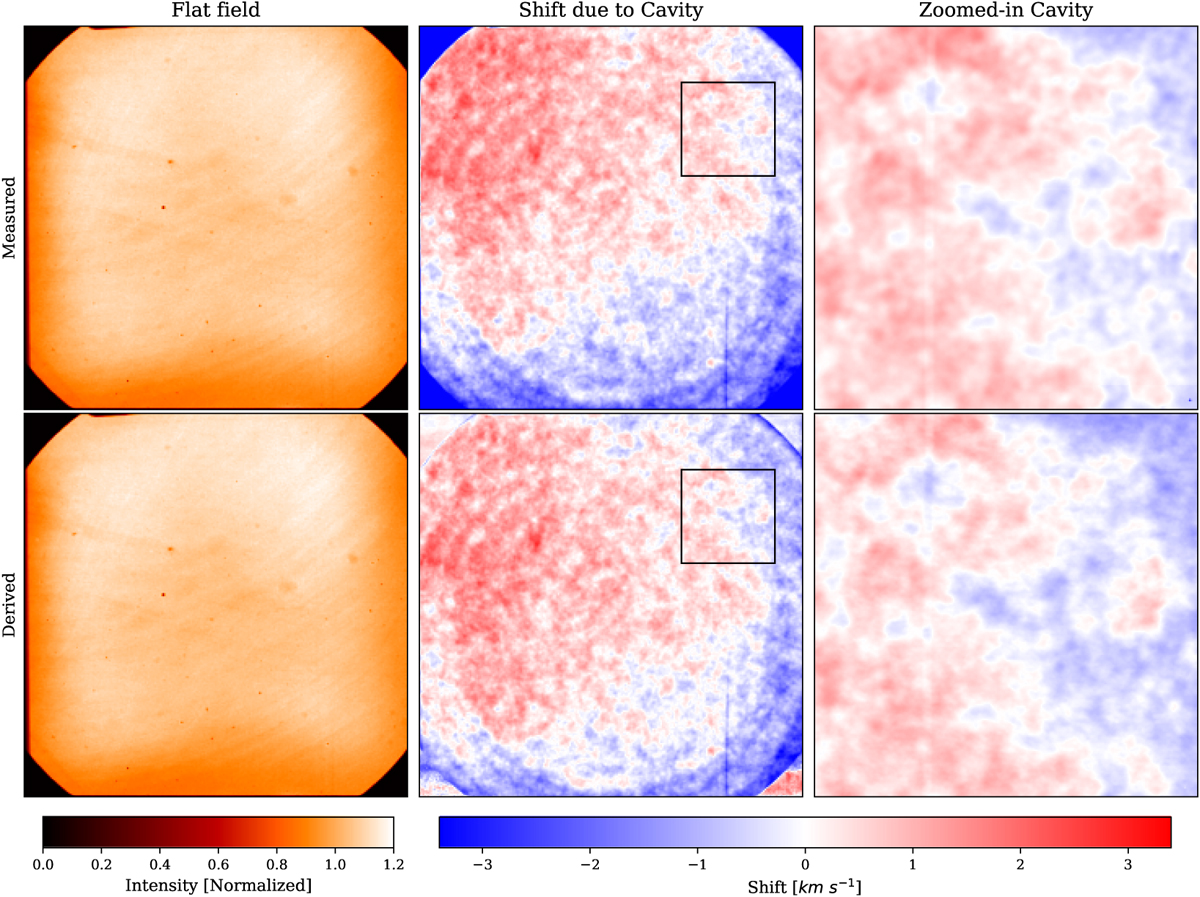
Comparison between the observed flat-field and cavity map (top row, left and center columns, respectively) and the derived flat-field (gain) and cavity map (∆a; bottom row, left and center columns, respectively). The right column in both rows showcases a zoomed-in region of each cavity map. The area corresponding to the zoomed-in region is indicated with a black square in the full cavity map to its left. The properties used to simulate SO/PHI’s etalon are R = 0.925, n = 2.29, d = 251.63 µm, f# = 60, Θ = 0.23°.
Current usage metrics show cumulative count of Article Views (full-text article views including HTML views, PDF and ePub downloads, according to the available data) and Abstracts Views on Vision4Press platform.
Data correspond to usage on the plateform after 2015. The current usage metrics is available 48-96 hours after online publication and is updated daily on week days.
Initial download of the metrics may take a while.