Fig. 3
Download original image
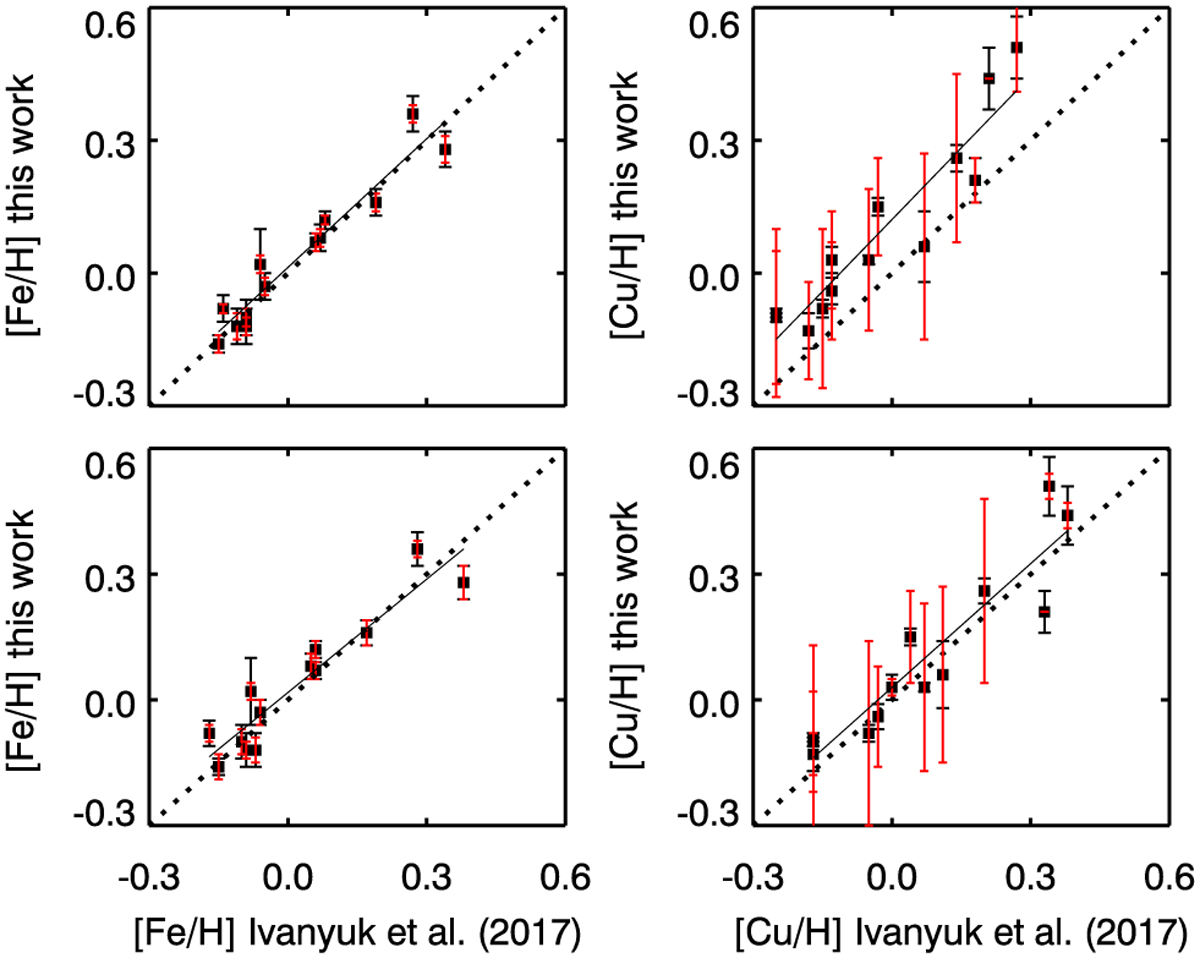
[Fe/H] and [Cu/H] in this analysis using the VALD3 line list and in Ivanyuk et al. (2017) using the VALD2 line list (top panels). The same, but using the VALD3 linelist in both analyses (lower panels). The red error bars belong to the data of Ivanyuk et al. (2017), and the black bars belong to the present work. The linear fit to the data is shown by the solid line. The position of the equidistant values is indicated by the dotted line.
Current usage metrics show cumulative count of Article Views (full-text article views including HTML views, PDF and ePub downloads, according to the available data) and Abstracts Views on Vision4Press platform.
Data correspond to usage on the plateform after 2015. The current usage metrics is available 48-96 hours after online publication and is updated daily on week days.
Initial download of the metrics may take a while.