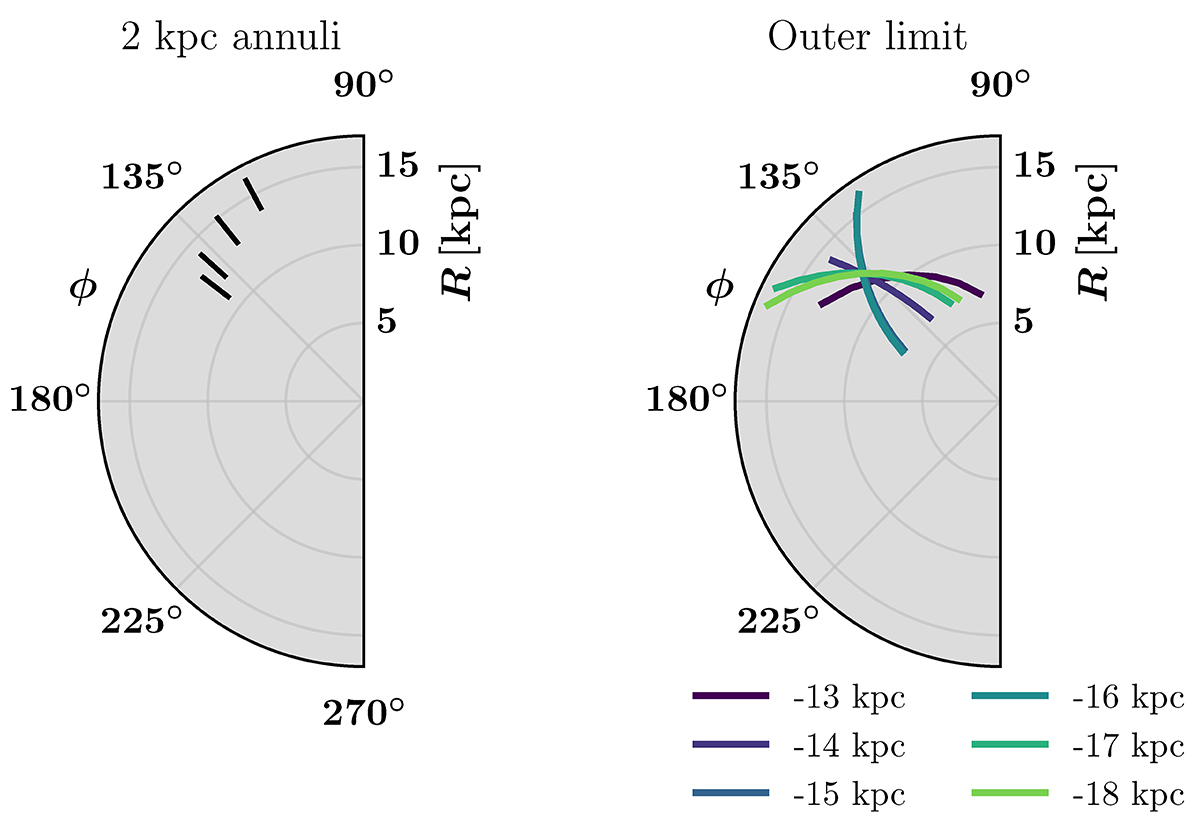
Fig. 7.
Download original image
Position of the line of nodes for two of our robustness tests. The left panel shows the results of our Classical model when we cut the data into 2 kpc wide rings from 11 − 13 kpc to 14 − 16 kpc. The right panel shows our Classical twisted model when we cut the data at different maximum radii from 13 to 18 kpc. To avoid clutter in the figures we only show the line of nodes for the best fitting model for each sample. It is worth noting that in the right panel the models for data with R < 15 or 16 kpc are so similar that they sit on almost perfectly top of each other. The different trends seen for the different samples make it hard to draw concrete conclusions about the twist of the line of nodes.
Current usage metrics show cumulative count of Article Views (full-text article views including HTML views, PDF and ePub downloads, according to the available data) and Abstracts Views on Vision4Press platform.
Data correspond to usage on the plateform after 2015. The current usage metrics is available 48-96 hours after online publication and is updated daily on week days.
Initial download of the metrics may take a while.