Fig. 3.
Download original image
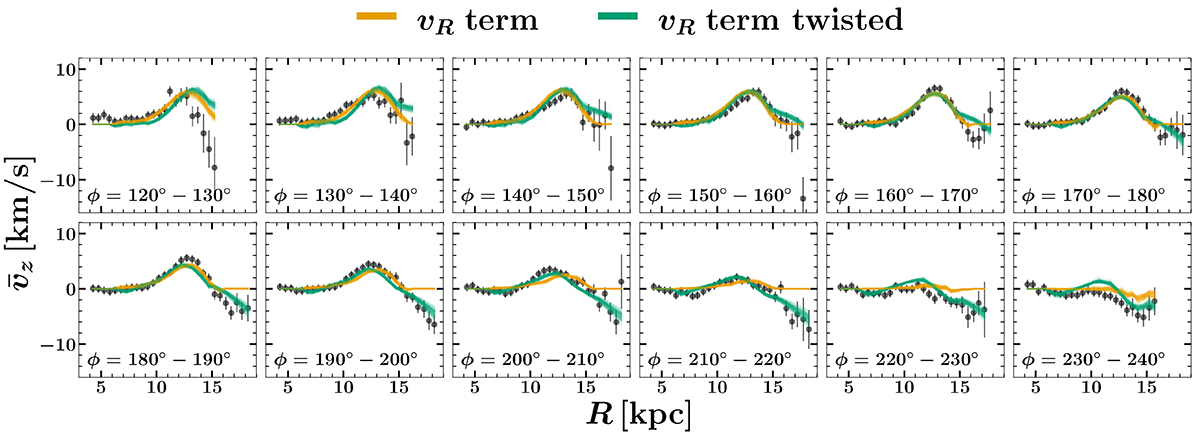
Fits to the ![]() data for the vR term models. As in Fig. 2, each panel shows data for 10° sectors of the Galaxy, and plots the average vz in 0.5 kpc bins, with associated uncertainties (statistical and systematic). Note that the uncertainties are larger here because we include uncertainties propagated from the vR uncertainties. The models with a single value of ϕw and ωp are plotted in orange, while those of the twisted models are in green. Both models provided reasonable fits, but note in particular that model
data for the vR term models. As in Fig. 2, each panel shows data for 10° sectors of the Galaxy, and plots the average vz in 0.5 kpc bins, with associated uncertainties (statistical and systematic). Note that the uncertainties are larger here because we include uncertainties propagated from the vR uncertainties. The models with a single value of ϕw and ωp are plotted in orange, while those of the twisted models are in green. Both models provided reasonable fits, but note in particular that model ![]() values are all around zero at larger R.
values are all around zero at larger R.
Current usage metrics show cumulative count of Article Views (full-text article views including HTML views, PDF and ePub downloads, according to the available data) and Abstracts Views on Vision4Press platform.
Data correspond to usage on the plateform after 2015. The current usage metrics is available 48-96 hours after online publication and is updated daily on week days.
Initial download of the metrics may take a while.