Fig. 2.
Download original image
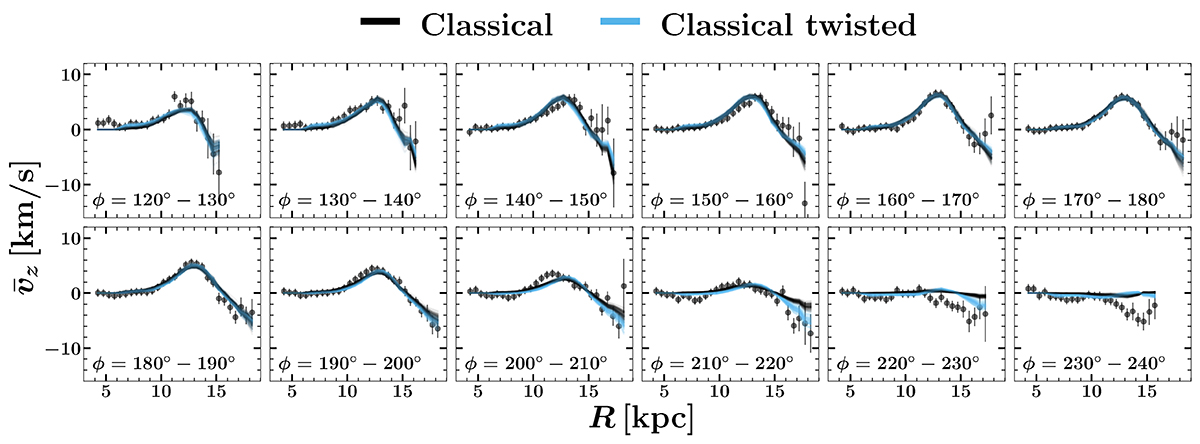
Fits to the ![]() data for Classical models. Each panel shows data for 10° sectors of the Galaxy, and plots the average vz in 0.5 kpc bins, with associated uncertainties (statistical and systematic). The model fits with a single value of ϕw and ωp are plotted in black, while those of the twisted model are in light blue. Overall both models provide reasonable fits, without major differences.
data for Classical models. Each panel shows data for 10° sectors of the Galaxy, and plots the average vz in 0.5 kpc bins, with associated uncertainties (statistical and systematic). The model fits with a single value of ϕw and ωp are plotted in black, while those of the twisted model are in light blue. Overall both models provide reasonable fits, without major differences.
Current usage metrics show cumulative count of Article Views (full-text article views including HTML views, PDF and ePub downloads, according to the available data) and Abstracts Views on Vision4Press platform.
Data correspond to usage on the plateform after 2015. The current usage metrics is available 48-96 hours after online publication and is updated daily on week days.
Initial download of the metrics may take a while.