Fig. 8.
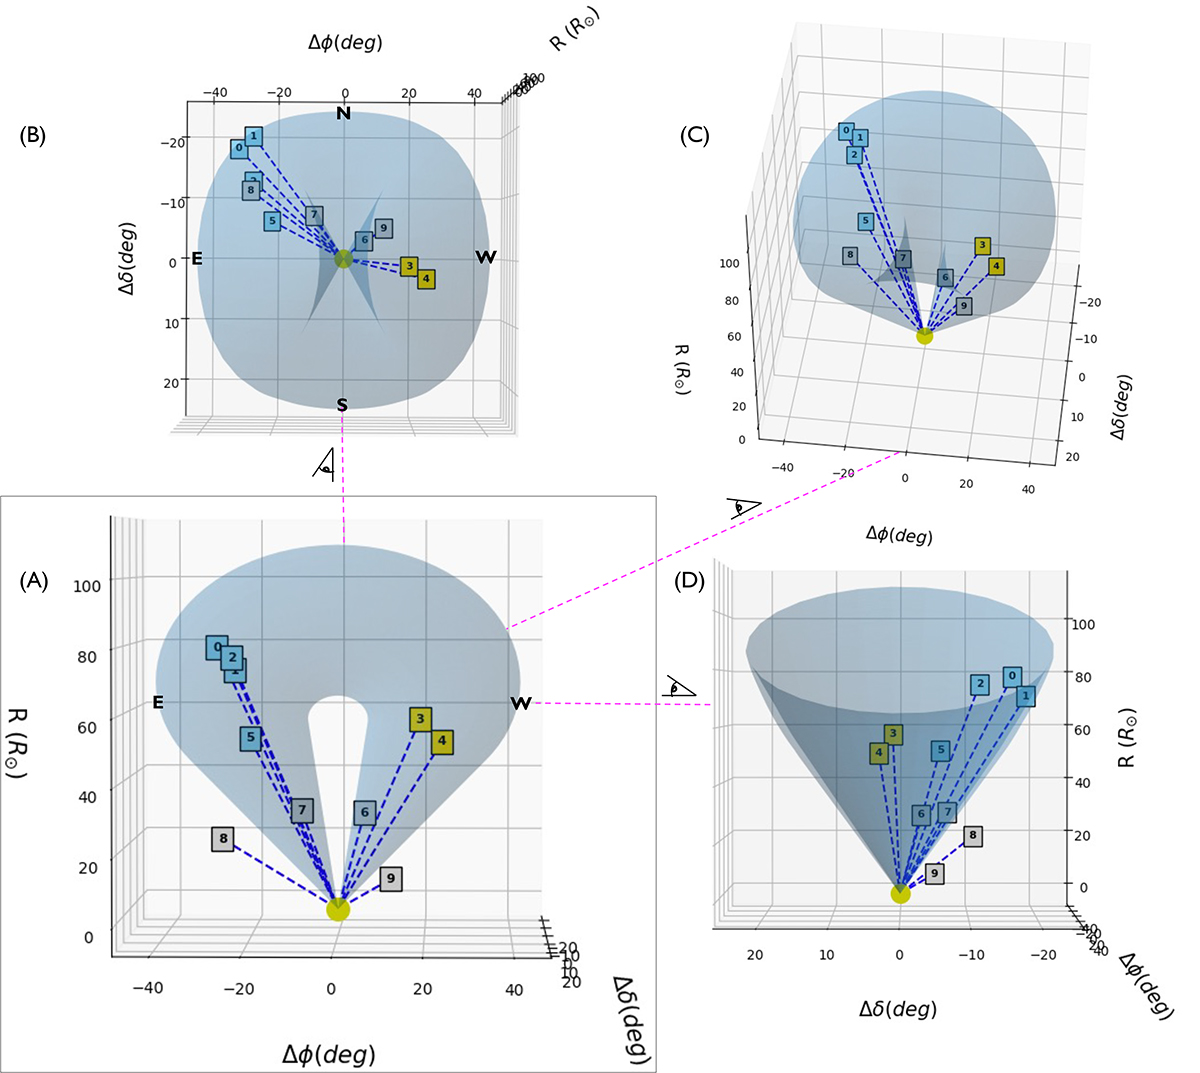
Download original image
Comparison of the positions of the local magnetic structures summarized in Table 1 together with the global CME flux rope modeled by GCS. All panels show 3D plots in a Δϕ, Δδ, R plane at 16:30 UT on December 9, 2022. The relative variation in longitude and latitude with respect to the central axis of the GCS are represented by Δϕ and Δδ, while R is the height. The letter W indicates the west, E is east, S is south and N is north. The eye represents the point of view of the observer. The colors of the boxes indicate the different families to which the features 0–9 belong: 1 (azure), 2 (yellow), and 3 (gray). The plot shows the following: (A) the frontal view of the GCS modeled flux rope and the relative location of the features with respect to its central axis; (B) the extension of the flux rope from a top view; (C) same as plot B but from a west-top view, (D) same as plot B but from the western leg.
Current usage metrics show cumulative count of Article Views (full-text article views including HTML views, PDF and ePub downloads, according to the available data) and Abstracts Views on Vision4Press platform.
Data correspond to usage on the plateform after 2015. The current usage metrics is available 48-96 hours after online publication and is updated daily on week days.
Initial download of the metrics may take a while.