Open Access
Fig. A.3.
Download original image
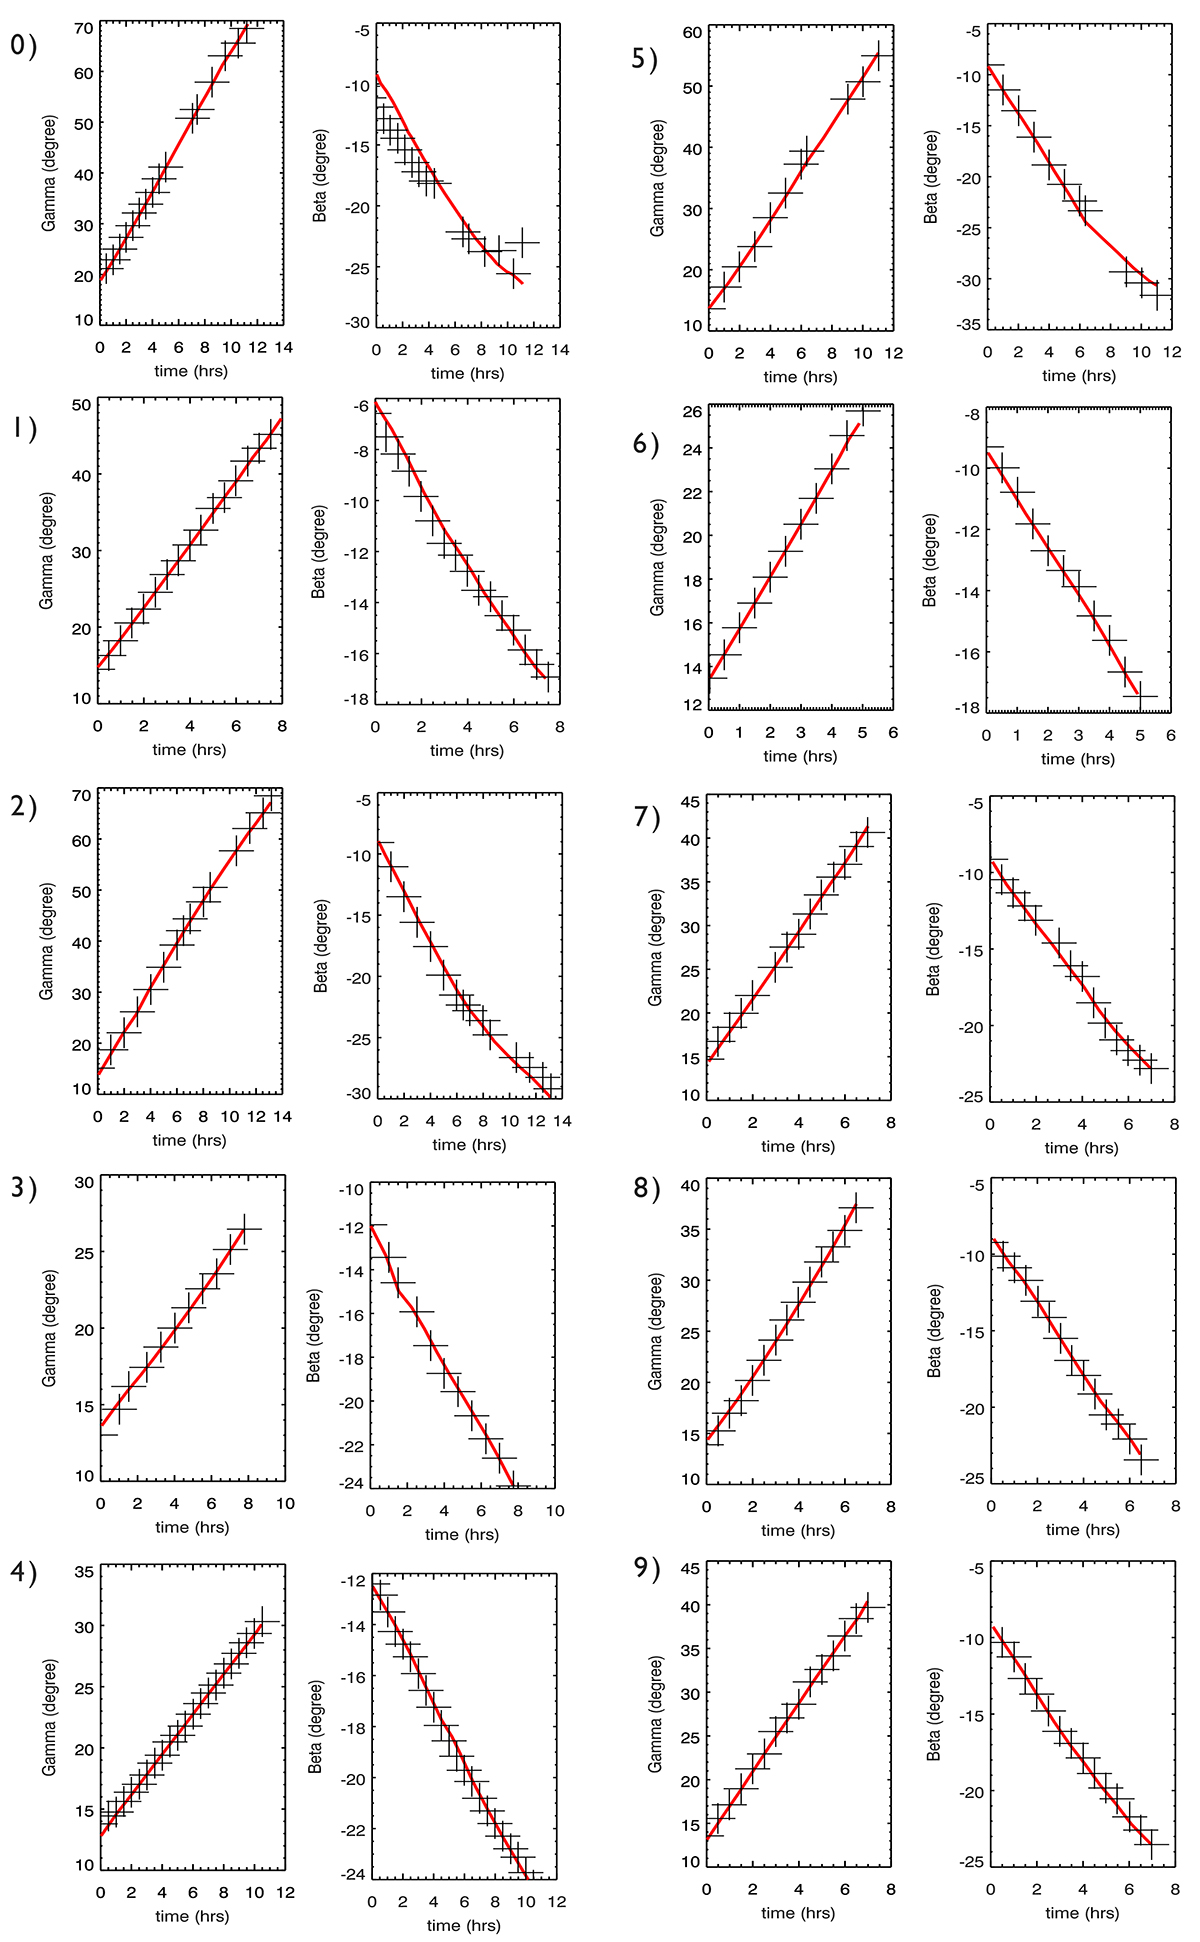
Results obtained for features (0 to 9) using the approach of (Braga & Vourlidas 2021). The black crosses are the measured angles γ and β, while the solid redline indicates the best fit of the equations discussed in Appendix A, with the parameters shown in Table 1.
Current usage metrics show cumulative count of Article Views (full-text article views including HTML views, PDF and ePub downloads, according to the available data) and Abstracts Views on Vision4Press platform.
Data correspond to usage on the plateform after 2015. The current usage metrics is available 48-96 hours after online publication and is updated daily on week days.
Initial download of the metrics may take a while.