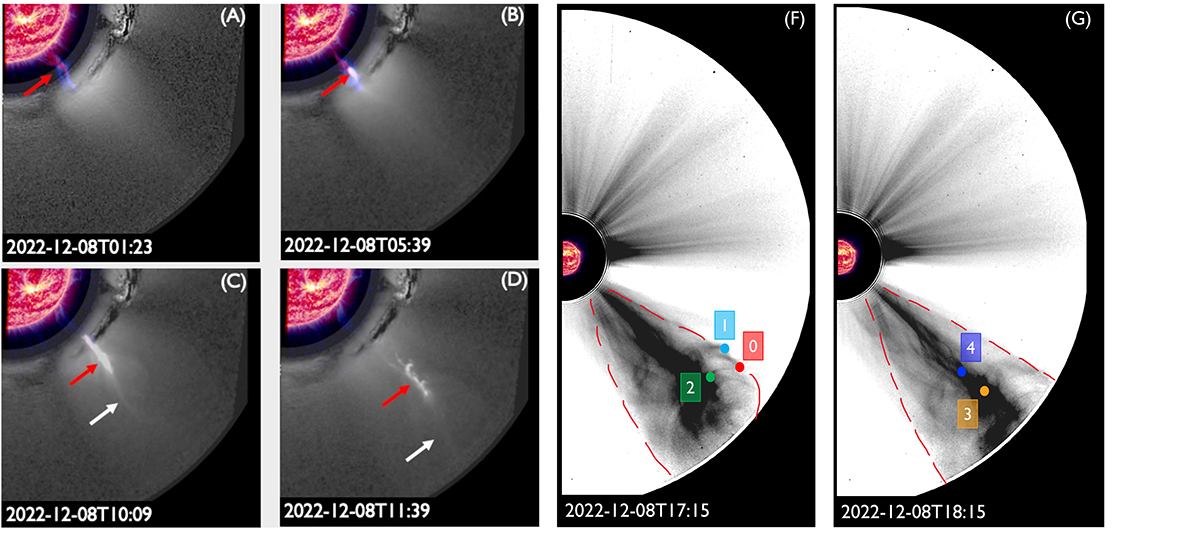
Fig. 10.
Download original image
Evolution of the CME between the EUV instruments and coronagraphs. Panels A–D show composite EUVI 171 (blue)/304 Å (red) images and STA/COR1 from December 8 between 01:23 and 11:39 UT. The white arrow indicates the hot horn shape, and the red arrow points to the cool filament material. Panels F and G show the features tracked in WISPR images with COR2 identifications (see Fig. 2).
Current usage metrics show cumulative count of Article Views (full-text article views including HTML views, PDF and ePub downloads, according to the available data) and Abstracts Views on Vision4Press platform.
Data correspond to usage on the plateform after 2015. The current usage metrics is available 48-96 hours after online publication and is updated daily on week days.
Initial download of the metrics may take a while.